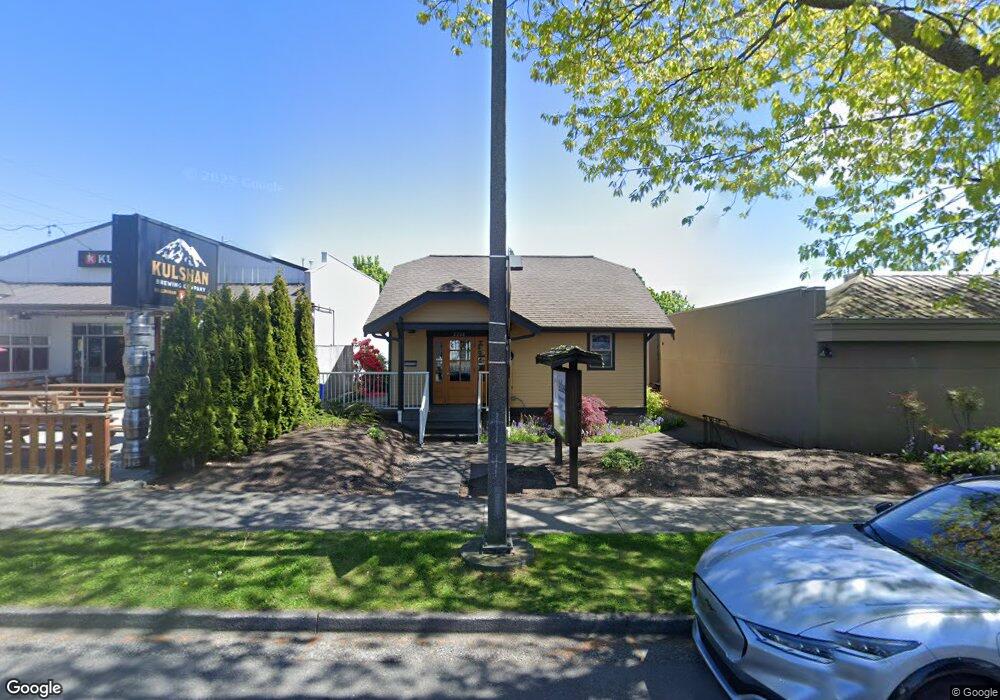
2228 James St Bellingham, WA 98225
Sunnyland NeighborhoodEstimated Value: $744,664
2
Beds
2
Baths
1,768
Sq Ft
$421/Sq Ft
Est. Value
About This Home
This home is located at 2228 James St, Bellingham, WA 98225 and is currently estimated at $744,664, approximately $421 per square foot. 2228 James St is a home located in Whatcom County with nearby schools including Sunnyland Elementary School, Whatcom Middle School, and Bellingham High School.
Ownership History
Date
Name
Owned For
Owner Type
Purchase Details
Closed on
Jan 23, 2009
Sold by
Winn Andrew and Winn Ravin
Bought by
Winn Properties Llc
Current Estimated Value
Purchase Details
Closed on
Nov 10, 2008
Sold by
Henderson Kenneth R and Henderson Janet D
Bought by
Winn Andrew and Winn Ravin
Home Financials for this Owner
Home Financials are based on the most recent Mortgage that was taken out on this home.
Original Mortgage
$300,000
Interest Rate
6.07%
Mortgage Type
Seller Take Back
Create a Home Valuation Report for This Property
The Home Valuation Report is an in-depth analysis detailing your home's value as well as a comparison with similar homes in the area
Home Values in the Area
Average Home Value in this Area
Purchase History
| Date | Buyer | Sale Price | Title Company |
|---|---|---|---|
| Winn Properties Llc | -- | None Available | |
| Winn Andrew | $325,280 | Chicago Title Insurance Co |
Source: Public Records
Mortgage History
| Date | Status | Borrower | Loan Amount |
|---|---|---|---|
| Previous Owner | Winn Andrew | $300,000 |
Source: Public Records
Tax History Compared to Growth
Tax History
| Year | Tax Paid | Tax Assessment Tax Assessment Total Assessment is a certain percentage of the fair market value that is determined by local assessors to be the total taxable value of land and additions on the property. | Land | Improvement |
|---|---|---|---|---|
| 2024 | $3,732 | $479,384 | $234,099 | $245,285 |
| 2023 | $3,732 | $479,384 | $234,099 | $245,285 |
| 2022 | $3,519 | $431,878 | $210,900 | $220,978 |
| 2021 | $3,729 | $378,840 | $185,000 | $193,840 |
| 2020 | $3,466 | $378,840 | $185,000 | $193,840 |
| 2019 | $3,211 | $340,360 | $157,360 | $183,000 |
| 2018 | $3,703 | $316,135 | $146,160 | $169,975 |
| 2017 | $2,973 | $311,714 | $144,116 | $167,598 |
| 2016 | $2,603 | $261,544 | $144,250 | $117,294 |
| 2015 | $2,552 | $238,418 | $131,750 | $106,668 |
| 2014 | -- | $226,203 | $125,000 | $101,203 |
| 2013 | -- | $241,893 | $131,250 | $110,643 |
Source: Public Records
Map
Nearby Homes
- 2014 Iron St
- 2008 Iron St
- 2627 Iron St
- 214 Carolina St
- 2430 Ellis St
- 3020 E North St
- 3024 E North St
- 2728 Humboldt St
- 2500 Cornwall Ave
- 2019 Cornwall Ave
- 2306 C St
- 1625 Lincoln St
- 607 E Illinois St
- 2929 Nevada St
- 1737 Sunup Loop
- 1735 Sunup Loop
- 1733 Sunup Loop
- 2100 C St
- 2330 Verona St
- 2518 S Park Dr