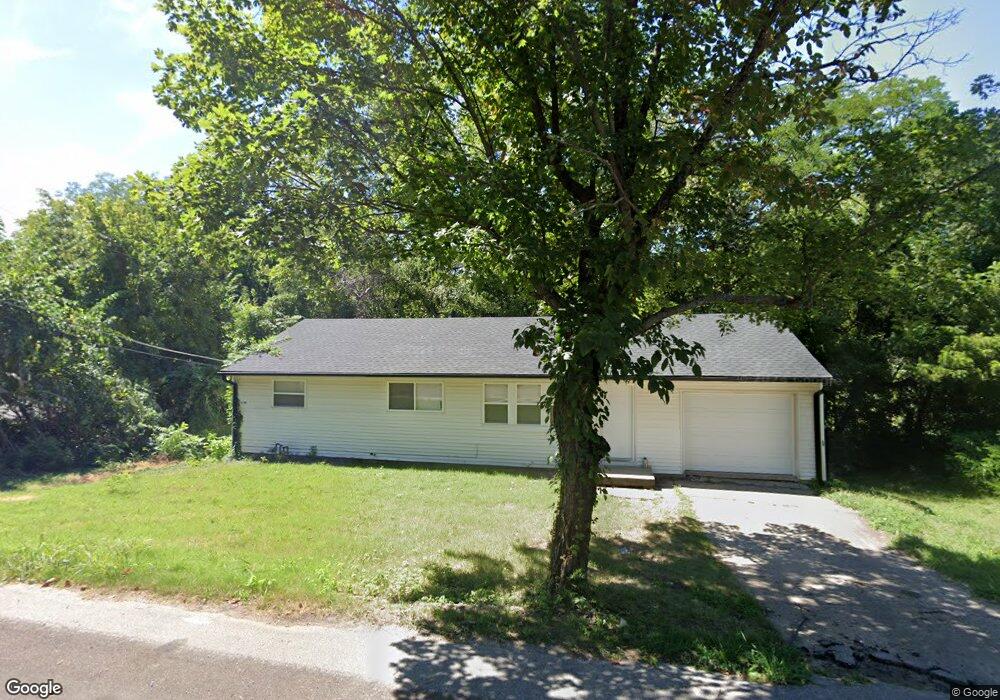
2228 S Home Ave Independence, MO 64052
Hill Park NeighborhoodEstimated Value: $139,000 - $168,000
3
Beds
2
Baths
1,144
Sq Ft
$136/Sq Ft
Est. Value
About This Home
This home is located at 2228 S Home Ave, Independence, MO 64052 and is currently estimated at $155,818, approximately $136 per square foot. 2228 S Home Ave is a home located in Jackson County with nearby schools including Korte Elementary School, Clifford H. Nowlin Middle School, and Van Horn High School.
Ownership History
Date
Name
Owned For
Owner Type
Purchase Details
Closed on
Oct 30, 2024
Sold by
Tung Judy and Nguyen Vincent Vinh
Bought by
Javt Home Solutions Llc
Current Estimated Value
Home Financials for this Owner
Home Financials are based on the most recent Mortgage that was taken out on this home.
Original Mortgage
$150,000
Outstanding Balance
$148,498
Interest Rate
6.09%
Mortgage Type
New Conventional
Estimated Equity
$7,320
Purchase Details
Closed on
Nov 3, 2023
Sold by
Fountain City Renewal Llc
Bought by
Tung Judy
Purchase Details
Closed on
Oct 4, 2023
Sold by
Thompson Randy G
Bought by
Dalrock Independence Llc
Purchase Details
Closed on
Sep 25, 2023
Sold by
Thompson Phyllis L
Bought by
Thompson Randy G
Purchase Details
Closed on
Dec 18, 2006
Sold by
Thompson Randy G
Bought by
Thompson Randy G and Thompson Phyllis L
Home Financials for this Owner
Home Financials are based on the most recent Mortgage that was taken out on this home.
Original Mortgage
$35,500
Interest Rate
6.37%
Mortgage Type
Stand Alone Refi Refinance Of Original Loan
Create a Home Valuation Report for This Property
The Home Valuation Report is an in-depth analysis detailing your home's value as well as a comparison with similar homes in the area
Home Values in the Area
Average Home Value in this Area
Purchase History
| Date | Buyer | Sale Price | Title Company |
|---|---|---|---|
| Javt Home Solutions Llc | -- | Superior Title | |
| Tung Judy | -- | None Listed On Document | |
| Fountain City Renewal Llc | -- | First American Title | |
| Dalrock Independence Llc | -- | Secured Title | |
| Dalrock Independence Llc | -- | Secured Title | |
| Thompson Randy G | -- | Secured Title | |
| Thompson Randy G | -- | None Listed On Document | |
| Thompson Randy G | -- | Lsi |
Source: Public Records
Mortgage History
| Date | Status | Borrower | Loan Amount |
|---|---|---|---|
| Open | Javt Home Solutions Llc | $150,000 | |
| Previous Owner | Thompson Randy G | $35,500 |
Source: Public Records
Tax History Compared to Growth
Tax History
| Year | Tax Paid | Tax Assessment Tax Assessment Total Assessment is a certain percentage of the fair market value that is determined by local assessors to be the total taxable value of land and additions on the property. | Land | Improvement |
|---|---|---|---|---|
| 2025 | $1,150 | $18,546 | $3,211 | $15,335 |
| 2024 | $1,150 | $16,127 | $2,842 | $13,285 |
| 2023 | $1,122 | $16,127 | $1,239 | $14,888 |
| 2022 | $1,143 | $15,010 | $2,346 | $12,664 |
| 2021 | $1,139 | $15,010 | $2,346 | $12,664 |
| 2020 | $1,172 | $15,038 | $2,346 | $12,692 |
| 2019 | $1,155 | $15,038 | $2,346 | $12,692 |
| 2018 | $1,034 | $13,088 | $2,042 | $11,046 |
| 2017 | $1,032 | $13,088 | $2,042 | $11,046 |
| 2016 | $1,032 | $12,760 | $1,957 | $10,803 |
| 2014 | $981 | $12,388 | $1,900 | $10,488 |
Source: Public Records
Map
Nearby Homes
- 2004 S Hawthorne Ave
- 9809 E 25th St S
- 2409 S Arlington Ave
- 2511 S Evanston Ave
- 2512 S Evanston Ave
- 1927 S Ash Ave
- 1929 S Crescent Ave
- 2515 S Arlington Ave
- 1815 S Evanston Ave
- 1810 S Maywood Ave
- 9613 E 25th Terrace S
- 1806 S Evanston Ave
- 2022 S Hedges Ave
- 10626 E 23rd St S
- 1911 S Ralston Ave
- 2005 S Hedges Ave
- 10710 E 24th St S
- 2613 S Westport Rd
- 2247 Blue Ridge Blvd
- 1811 S Brookside Ave
- 2225 S Home Ave
- 2222 S Home Ave
- 2223 S Home Ave
- 2221 S Home Ave
- 2214 S Home Ave
- 2215 S Home Ave
- 9834 E 23rd St S
- 2213 S Home Ave
- 2211 S Hawthorne Ave
- 2223 S Hawthorne Ave
- 2221 S Hawthorne Ave
- 2212 S Home Ave
- 2211 S Home Ave
- 2211 S Home Ave
- 2218 S Hall Rd
- 2213 S Hawthorne Ave
- 9830 E 23rd St S
- 10001 E 23rd St S
- 9915 E 23rd St S
- 2216 S Hall Rd