
Seller's Agent in 2025
Amy Savage
A Group Real Estate
(503) 709-8039
344 Total Sales
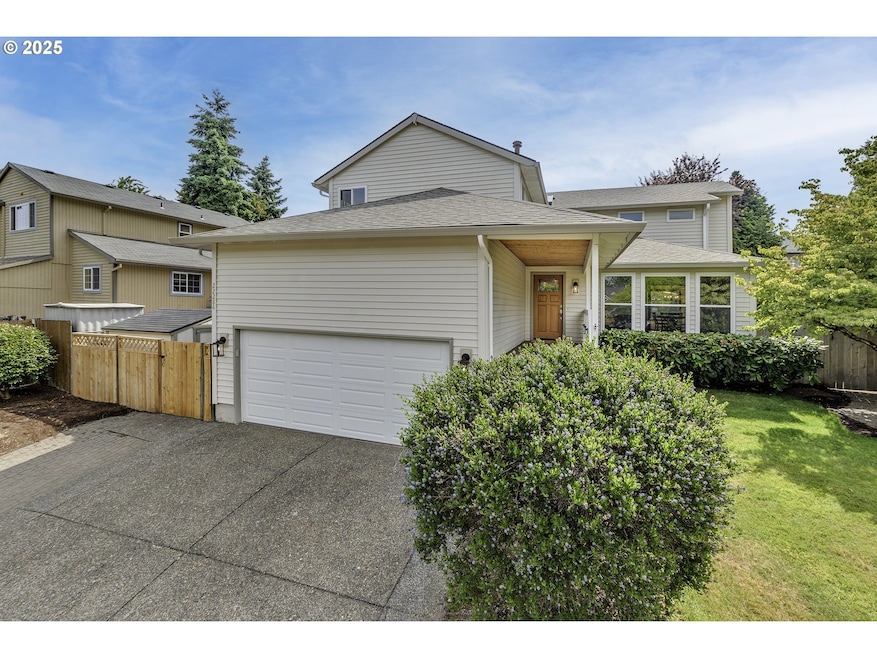


This well-maintained NW Contemporary home features hardwood floors & several updates including quartz countertops, fresh interior paint & brand new carpet. Vaulted ceilings, skylights & large windows fill the rooms w/natural light. Living room w/French doors opens to dining room. Kitchen has quartz countertops, eating island & stainless applcs, including blt-in gas range & refrigerator. Spacious family room w/fireplace & slider to patio. Primary ste has w-in closet & blt-ins & vaulted bathroom w/dual sinks, tiled shower & LVP flooring. Main level 4th bdrm is great for guests or home office. Beautiful fenced backyard w/extended paver patio, grass & turf is ideal for relaxing and entertaining. Garage w/spacious storage loft. Vinyl windows. Ecobee thermostat. SimpliSafe security system. Auto-sprinklers. Roof (2023). Gas water heater (2025). AC (2019). Located in a sought-after & convenient neighborhood.
Last Agent to Sell the Property
A Group Real Estate Brokerage Phone: 503-692-5000 License #200204168 Listed on: 06/19/2025
| Date | Type | Sale Price | Title Company |
|---|---|---|---|
| Warranty Deed | $695,000 | Wfg Title | |
| Warranty Deed | -- | None Listed On Document | |
| Interfamily Deed Transfer | -- | Ticor Title | |
| Interfamily Deed Transfer | -- | Chicago Title Insurance Co | |
| Warranty Deed | $174,900 | Ticor Title |
| Date | Status | Loan Amount | Loan Type |
|---|---|---|---|
| Open | $556,000 | New Conventional | |
| Previous Owner | $209,900 | New Conventional | |
| Previous Owner | $157,400 | No Value Available |
| Date | Event | Price | List to Sale | Price per Sq Ft |
|---|---|---|---|---|
| 07/11/2025 07/11/25 | Sold | $695,000 | 0.0% | $291 / Sq Ft |
| 06/23/2025 06/23/25 | Pending | -- | -- | -- |
| 06/19/2025 06/19/25 | For Sale | $695,000 | -- | $291 / Sq Ft |
| Year | Tax Paid | Tax Assessment Tax Assessment Total Assessment is a certain percentage of the fair market value that is determined by local assessors to be the total taxable value of land and additions on the property. | Land | Improvement |
|---|---|---|---|---|
| 2025 | $6,671 | $392,220 | -- | -- |
| 2024 | $6,496 | $380,800 | -- | -- |
| 2023 | $6,496 | $369,710 | $0 | $0 |
| 2022 | $6,216 | $369,710 | $0 | $0 |
| 2021 | $6,064 | $348,500 | $0 | $0 |
| 2020 | $5,884 | $338,350 | $0 | $0 |
| 2019 | $5,726 | $328,500 | $0 | $0 |
| 2018 | $5,494 | $318,940 | $0 | $0 |
| 2017 | $5,172 | $309,660 | $0 | $0 |
| 2016 | $4,932 | $300,650 | $0 | $0 |
| 2015 | $4,391 | $273,440 | $0 | $0 |
| 2014 | $4,225 | $265,480 | $0 | $0 |
Seller's Agent in 2025
Amy Savage
A Group Real Estate
(503) 709-8039
344 Total Sales
Buyer's Agent in 2025
Richard Brazovan
MORE Realty
(503) 353-6673
36 Total Sales
Source: Regional Multiple Listing Service (RMLS)
MLS Number: 656395877
APN: R1225338
Disclaimer: Certain information contained herein is derived from information provided by parties other than Homes.com. All information provided is deemed reliable, but is not guaranteed to be accurate and should be independently verified.
![]() The content relating to real estate for sale on this web site comes in part from the IDX program of the RMLS™ of Portland, Oregon. Real estate listings held by brokerage firms other than Ten-X are marked with the RMLS™ logo, and detailed information about these properties includes the names of the listing brokers. Listing content is copyright © 2025 RMLS™, Portland, Oregon. Some properties which appear for sale on this web site may subsequently have sold or may no longer be available. All information provided is deemed reliable but is not guaranteed and should be independently verified.
The content relating to real estate for sale on this web site comes in part from the IDX program of the RMLS™ of Portland, Oregon. Real estate listings held by brokerage firms other than Ten-X are marked with the RMLS™ logo, and detailed information about these properties includes the names of the listing brokers. Listing content is copyright © 2025 RMLS™, Portland, Oregon. Some properties which appear for sale on this web site may subsequently have sold or may no longer be available. All information provided is deemed reliable but is not guaranteed and should be independently verified.