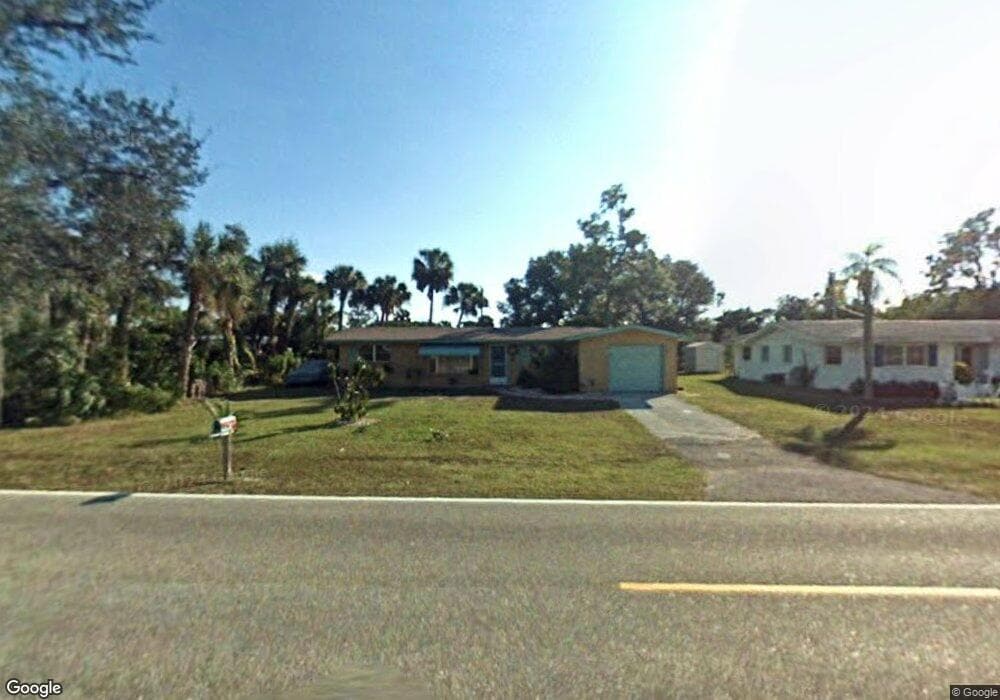
22289 Olean Blvd Port Charlotte, FL 33952
Estimated Value: $158,000 - $230,000
3
Beds
2
Baths
1,340
Sq Ft
$153/Sq Ft
Est. Value
About This Home
This home is located at 22289 Olean Blvd, Port Charlotte, FL 33952 and is currently estimated at $205,198, approximately $153 per square foot. 22289 Olean Blvd is a home located in Charlotte County with nearby schools including Peace River Elementary School, Port Charlotte Middle School, and Charlotte High School.
Ownership History
Date
Name
Owned For
Owner Type
Purchase Details
Closed on
Apr 8, 2005
Sold by
Leifs Llc
Bought by
Pereida James C and Pereida Victoria L
Current Estimated Value
Home Financials for this Owner
Home Financials are based on the most recent Mortgage that was taken out on this home.
Original Mortgage
$75,000
Interest Rate
5.74%
Mortgage Type
Fannie Mae Freddie Mac
Purchase Details
Closed on
Sep 23, 2002
Sold by
Houkom Leif
Bought by
Leifs L L C and 22289 Olean Blvd Tr
Purchase Details
Closed on
Dec 13, 2000
Sold by
Leif Houkom Ltd
Bought by
Houkom Leif
Home Financials for this Owner
Home Financials are based on the most recent Mortgage that was taken out on this home.
Original Mortgage
$44,000
Interest Rate
7.79%
Mortgage Type
Purchase Money Mortgage
Purchase Details
Closed on
Aug 15, 2000
Sold by
Stallard James J
Bought by
Leif Houkom Ltd
Purchase Details
Closed on
Mar 23, 2000
Sold by
Stallard James J and Stallard Betty J
Bought by
Stallard James J
Create a Home Valuation Report for This Property
The Home Valuation Report is an in-depth analysis detailing your home's value as well as a comparison with similar homes in the area
Home Values in the Area
Average Home Value in this Area
Purchase History
| Date | Buyer | Sale Price | Title Company |
|---|---|---|---|
| Pereida James C | $110,600 | Executive Title Ins Svcs Inc | |
| Leifs L L C | -- | -- | |
| Houkom Leif | -- | -- | |
| Leif Houkom Ltd | $40,000 | -- | |
| Stallard James J | $11,900 | -- |
Source: Public Records
Mortgage History
| Date | Status | Borrower | Loan Amount |
|---|---|---|---|
| Closed | Pereida James C | $75,000 | |
| Previous Owner | Houkom Leif | $44,000 |
Source: Public Records
Tax History Compared to Growth
Tax History
| Year | Tax Paid | Tax Assessment Tax Assessment Total Assessment is a certain percentage of the fair market value that is determined by local assessors to be the total taxable value of land and additions on the property. | Land | Improvement |
|---|---|---|---|---|
| 2023 | $2,605 | $134,885 | $18,700 | $116,185 |
| 2022 | $2,574 | $148,459 | $13,175 | $135,284 |
| 2021 | $2,379 | $122,692 | $5,780 | $116,912 |
| 2020 | $2,224 | $114,305 | $5,015 | $109,290 |
| 2019 | $2,090 | $111,246 | $5,015 | $106,231 |
| 2018 | $1,829 | $102,112 | $4,250 | $97,862 |
| 2017 | $1,712 | $90,350 | $4,012 | $86,338 |
| 2016 | $1,571 | $55,381 | $0 | $0 |
| 2015 | $1,500 | $50,346 | $0 | $0 |
| 2014 | $1,288 | $45,769 | $0 | $0 |
Source: Public Records
Map
Nearby Homes
- 22337 Olean Blvd
- 22348 Olean Blvd
- 22217 Olean Blvd
- 22201 Olean Blvd
- 3090 Lockwood St
- 3122 Scranton St
- 22271 Morris Ave
- 22220 & 22228 Lockport Ave
- 22237 Lockport Ave
- 22400 Lacombe Ave
- 22457 Oceanside Ave
- 22448 Lacombe Ave
- 22480 Oceanside Ave
- 22465 Lewiston Ave
- 22357 Nyack Ave
- 22381 Nyack Ave
- 3335 Brooklyn Ave
- 3295 Brooklyn Ave
- 2368 Starlite Ln
- 22309 Nyack Ave
- 22281 Boulevard
- 22281 Olean Blvd
- 22286 New York Ave
- 22294 New York Ave
- 22273 Olean Blvd
- 22305 Olean Blvd
- 22278 New York Ave
- 22270 New York Ave
- 2570 Sistina St
- 22302 New York Ave
- 22272 Olean Blvd
- 22265 Olean Blvd
- 22306 Olean Blvd
- 2560 Street
- 22285 New York Ave
- 2560 Sistina St
- 22264 Olean Blvd
- 22321 Olean Blvd
- 2551 Sistina St
- 22314 Olean Blvd