Estimated Value: $402,000 - $458,000
4
Beds
2
Baths
2,214
Sq Ft
$193/Sq Ft
Est. Value
About This Home
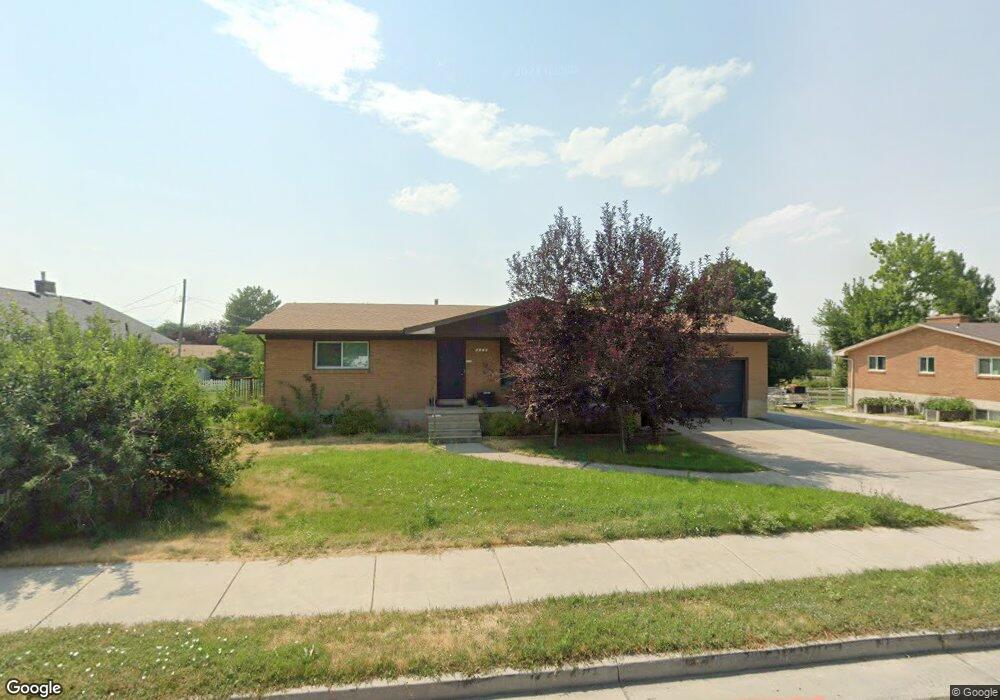
This home is located at 2229 N 800 E, Logan, UT 84341 and is currently estimated at $426,506, approximately $192 per square foot. 2229 N 800 E is a home located in Cache County with nearby schools including Greenville School, Cedar Ridge School, and North Cache Middle School.
Ownership History
Date
Name
Owned For
Owner Type
Purchase Details
Closed on
Oct 14, 2021
Sold by
Pack Phillip T
Bought by
Pack Phillip T and Pack Franklin William
Current Estimated Value
Home Financials for this Owner
Home Financials are based on the most recent Mortgage that was taken out on this home.
Original Mortgage
$180,000
Outstanding Balance
$163,429
Interest Rate
2.8%
Mortgage Type
New Conventional
Estimated Equity
$263,077
Purchase Details
Closed on
Dec 9, 2016
Sold by
Collins Sean T
Bought by
Pack Phillip T
Purchase Details
Closed on
Jan 2, 2015
Sold by
Barnett Dana
Bought by
Collins Sean T and Pack Frank William
Home Financials for this Owner
Home Financials are based on the most recent Mortgage that was taken out on this home.
Original Mortgage
$148,265
Interest Rate
3.86%
Mortgage Type
FHA
Purchase Details
Closed on
Apr 19, 2013
Sold by
Barnett Patricia W
Bought by
Barnett Dana and Patricia W Barnett Trust
Create a Home Valuation Report for This Property
The Home Valuation Report is an in-depth analysis detailing your home's value as well as a comparison with similar homes in the area
Home Values in the Area
Average Home Value in this Area
Purchase History
| Date | Buyer | Sale Price | Title Company |
|---|---|---|---|
| Pack Phillip T | -- | None Listed On Document | |
| Pack Phillip T | -- | None Listed On Document | |
| Pack Phillip T | -- | Pinnacle Title | |
| Collins Sean T | -- | Cache Title Company | |
| Barnett Dana | -- | None Available |
Source: Public Records
Mortgage History
| Date | Status | Borrower | Loan Amount |
|---|---|---|---|
| Open | Pack Phillip T | $180,000 | |
| Closed | Pack Phillip T | $180,000 | |
| Previous Owner | Collins Sean T | $148,265 |
Source: Public Records
Tax History
| Year | Tax Paid | Tax Assessment Tax Assessment Total Assessment is a certain percentage of the fair market value that is determined by local assessors to be the total taxable value of land and additions on the property. | Land | Improvement |
|---|---|---|---|---|
| 2025 | $1,569 | $219,690 | $0 | $0 |
| 2024 | $1,859 | $242,205 | $0 | $0 |
| 2023 | $1,712 | $208,680 | $0 | $0 |
| 2022 | $1,792 | $208,675 | $0 | $0 |
| 2021 | $1,691 | $305,340 | $93,700 | $211,640 |
| 2020 | $1,515 | $256,500 | $93,700 | $162,800 |
| 2019 | $1,586 | $256,500 | $93,700 | $162,800 |
| 2018 | $1,040 | $163,124 | $56,500 | $106,624 |
| 2017 | $1,011 | $83,435 | $0 | $0 |
| 2016 | $1,027 | $83,435 | $0 | $0 |
| 2015 | $1,031 | $83,435 | $0 | $0 |
| 2014 | $1,006 | $83,435 | $0 | $0 |
| 2013 | -- | $82,555 | $0 | $0 |
Source: Public Records
Map
Nearby Homes
- 2284 N 740 E
- 741 E 2200 N
- 2168 N 750 E
- 710 E 2160 N
- 2469 N 620 E Unit 3
- 2477 N 620 E Unit 4
- 1593 N 110 W Unit 201
- 611 E 2450 N Unit 1
- 1593 N 110 W Unit 202
- 1593 N 110 W Unit 204
- 1200 W 1400 N
- 2950 N Mahogony Valley Rd E Unit 7
- 1598 N Sharptail Cir
- 1000 W 2500 N
- 1872 N 515 W
- 385 E 2280 N Unit D
- 623 E 2475 N Unit 5
- 645 E 2475 N
- 667 E 2475 N
- 327 E 2230 N Unit A
Your Personal Tour Guide
Ask me questions while you tour the home.