2229 NE 120th Loop Branford, FL 32008
Estimated Value: $282,642 - $453,000
2
Beds
1
Bath
1,033
Sq Ft
$357/Sq Ft
Est. Value
About This Home
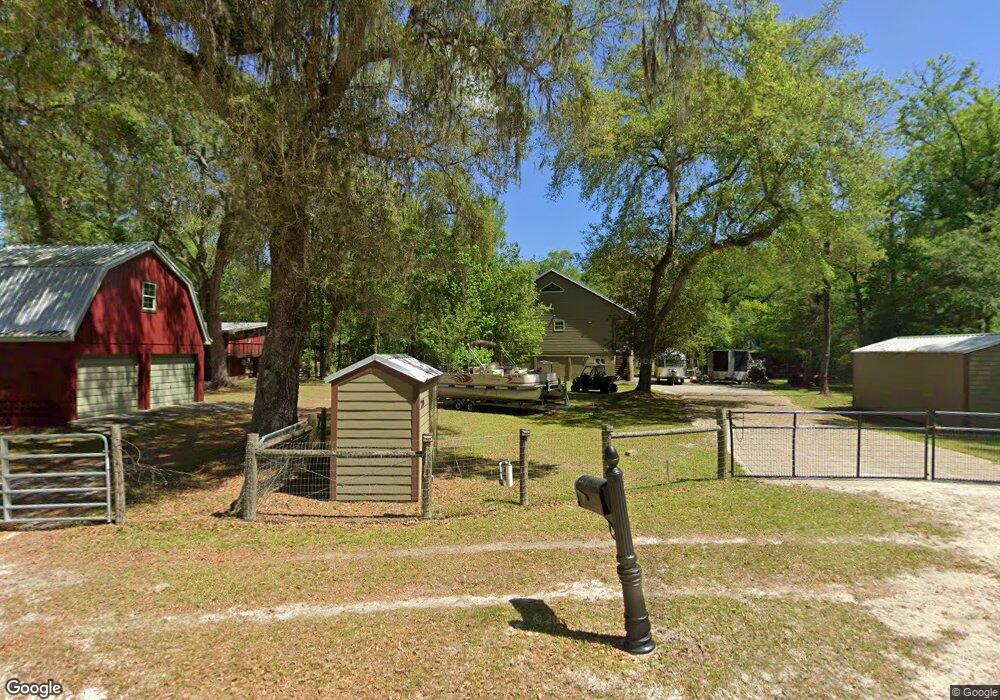
This home is located at 2229 NE 120th Loop, Branford, FL 32008 and is currently estimated at $368,661, approximately $356 per square foot. 2229 NE 120th Loop is a home located in Gilchrist County.
Ownership History
Date
Name
Owned For
Owner Type
Purchase Details
Closed on
Oct 5, 2018
Sold by
Whittemore Terrence E and Magee Kristy
Bought by
Whitemore Terrence E and Magee Kristy Jo
Current Estimated Value
Purchase Details
Closed on
Dec 27, 2017
Sold by
Almond Neal R
Bought by
Whittwmore Terrence E and Magee Kristy Jo
Home Financials for this Owner
Home Financials are based on the most recent Mortgage that was taken out on this home.
Original Mortgage
$168,900
Outstanding Balance
$141,568
Interest Rate
3.95%
Mortgage Type
Purchase Money Mortgage
Estimated Equity
$227,093
Purchase Details
Closed on
Nov 21, 2017
Sold by
Almond Neal R
Bought by
Almond Neal R
Home Financials for this Owner
Home Financials are based on the most recent Mortgage that was taken out on this home.
Original Mortgage
$168,900
Outstanding Balance
$141,568
Interest Rate
3.95%
Mortgage Type
Purchase Money Mortgage
Estimated Equity
$227,093
Purchase Details
Closed on
Mar 12, 2014
Sold by
Almond Neal R and Almond Patricia A
Bought by
Almond Family Trust and Almond Neal R
Purchase Details
Closed on
Oct 28, 2011
Sold by
Brantley Shirley A and Hudson John N
Bought by
Almond Neal R
Create a Home Valuation Report for This Property
The Home Valuation Report is an in-depth analysis detailing your home's value as well as a comparison with similar homes in the area
Purchase History
| Date | Buyer | Sale Price | Title Company |
|---|---|---|---|
| Whitemore Terrence E | -- | Attorney | |
| Whittwmore Terrence E | $188,900 | Security Title Services Inc | |
| Almond Neal R | -- | Attorney | |
| Almond Family Trust | -- | Attorney | |
| Almond Neal R | $250,000 | Gilchrist Title Services |
Source: Public Records
Mortgage History
| Date | Status | Borrower | Loan Amount |
|---|---|---|---|
| Open | Whittwmore Terrence E | $168,900 |
Source: Public Records
Tax History
| Year | Tax Paid | Tax Assessment Tax Assessment Total Assessment is a certain percentage of the fair market value that is determined by local assessors to be the total taxable value of land and additions on the property. | Land | Improvement |
|---|---|---|---|---|
| 2025 | $3,818 | $250,428 | $136,800 | $113,628 |
| 2024 | $3,153 | $217,390 | $113,040 | $104,350 |
| 2023 | $3,153 | $185,121 | $0 | $0 |
| 2022 | $2,913 | $182,549 | $93,600 | $88,949 |
| 2021 | $2,700 | $154,821 | $79,200 | $75,621 |
| 2020 | $2,503 | $139,085 | $77,275 | $61,810 |
| 2019 | $2,471 | $135,445 | $77,275 | $58,170 |
| 2018 | $2,495 | $135,118 | $77,275 | $57,843 |
| 2017 | $2,236 | $118,596 | $0 | $0 |
| 2016 | $2,272 | $118,237 | $0 | $0 |
| 2015 | $2,258 | $114,855 | $0 | $0 |
| 2013 | -- | $114,646 | $0 | $0 |
Source: Public Records
Map
Nearby Homes
- 960 SW Iowa Dr
- 498 SW Manatee Terrace
- TBD SW Reno Way
- 135 SW Virginia Way
- 1759 NE 127th St
- 12890 NE 120 Loop
- TBD NE 17th Ave
- 0 NE 127th St
- 1965 SW Newark Dr
- 0 SW Bumble St Unit 128719
- 595 SW Trenton Terrace
- 207 SW Rose Ln
- 0 SW Newark Dr Unit MFRR4908315
- 0 SW Newark Dr Unit MFRR4908314
- 1366 SW Central Terrace
- 843 SW Illinois St
- 2560 NE 108th Place
- TBD NE 108th Place
- 268 Luke Rd
- 0 SW Boston Terrace Unit 2136827
- 2239 NE 120th Loop
- 2209 NE 120th Loop
- 2259 NE 120th Loop
- 2197 NE 120th Loop
- 2249 NE 120th Loop
- 2189 NE 120th Loop
- 1000 SW Iowa Dr
- 944 SW Iowa Dr
- 1026 SW Iowa Dr
- 2169 NE 120th Loop
- 0 NE 120th Loop
- Lot 2 NE 120th Loop
- 908 SW Iowa Dr
- 1029 SW Iowa Dr
- 969 SW Iowa Dr
- 890 SW Iowa Dr
- 870 SW Iowa Dr
- 2139 NE 120th Loop
- 917 SW Iowa Dr
- 846 SW Iowa Dr
Your Personal Tour Guide
Ask me questions while you tour the home.