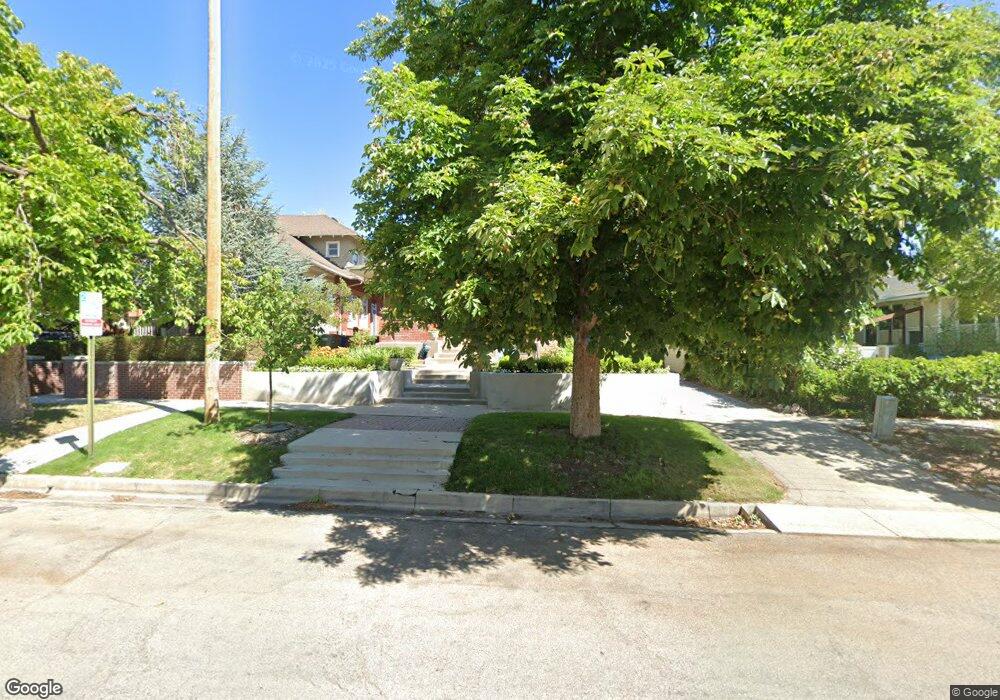
223 8th Ave Salt Lake City, UT 84103
The Avenues NeighborhoodEstimated Value: $763,952 - $892,000
5
Beds
2
Baths
2,709
Sq Ft
$305/Sq Ft
Est. Value
About This Home
This home is located at 223 8th Ave, Salt Lake City, UT 84103 and is currently estimated at $827,238, approximately $305 per square foot. 223 8th Ave is a home located in Salt Lake County with nearby schools including Ensign School, West High, and Open Classroom.
Ownership History
Date
Name
Owned For
Owner Type
Purchase Details
Closed on
Sep 12, 2016
Sold by
Hampton Debra M
Bought by
Hampton Debra Mae
Current Estimated Value
Purchase Details
Closed on
Dec 28, 2001
Sold by
Lasson Stacey Evans
Bought by
Hampton Debra M
Home Financials for this Owner
Home Financials are based on the most recent Mortgage that was taken out on this home.
Original Mortgage
$175,920
Interest Rate
6.51%
Create a Home Valuation Report for This Property
The Home Valuation Report is an in-depth analysis detailing your home's value as well as a comparison with similar homes in the area
Home Values in the Area
Average Home Value in this Area
Purchase History
| Date | Buyer | Sale Price | Title Company |
|---|---|---|---|
| Hampton Debra Mae | -- | None Available | |
| Hampton Debra M | -- | Superior Title |
Source: Public Records
Mortgage History
| Date | Status | Borrower | Loan Amount |
|---|---|---|---|
| Previous Owner | Hampton Debra M | $175,920 |
Source: Public Records
Tax History Compared to Growth
Tax History
| Year | Tax Paid | Tax Assessment Tax Assessment Total Assessment is a certain percentage of the fair market value that is determined by local assessors to be the total taxable value of land and additions on the property. | Land | Improvement |
|---|---|---|---|---|
| 2025 | $3,298 | $719,600 | $233,300 | $486,300 |
| 2024 | $3,298 | $629,200 | $222,700 | $406,500 |
| 2023 | $2,188 | $611,000 | $214,200 | $396,800 |
| 2022 | $3,404 | $587,400 | $210,000 | $377,400 |
| 2021 | $3,238 | $505,800 | $170,400 | $335,400 |
| 2020 | $3,072 | $456,800 | $159,300 | $297,500 |
| 2019 | $2,665 | $372,900 | $144,800 | $228,100 |
| 2018 | $2,705 | $368,500 | $144,800 | $223,700 |
| 2017 | $2,759 | $352,100 | $144,800 | $207,300 |
| 2016 | $2,431 | $294,700 | $127,400 | $167,300 |
| 2015 | $2,578 | $296,200 | $124,900 | $171,300 |
| 2014 | $2,812 | $320,500 | $124,900 | $195,600 |
Source: Public Records
Map
Nearby Homes
- 288 E 10th Ave
- 265 E 5th Ave
- 464 D St
- 265 N Center St
- 265 N "C" St
- 375 E 9th Ave
- 240 N Spencer Ct
- 229 N B St Unit 9
- 447 E St
- 216 B St
- 590 N Capitol Park Ave
- 619 Cortez St
- 171 E 3rd Ave Unit 709
- 171 E 3rd Ave Unit 301
- 171 E 3rd Ave Unit 601
- 605 N De Soto St
- 537 N Darwin St
- 692 Cortez St
- 152 E 3rd Ave
- 400 E Capitol Park Ave Unit 203