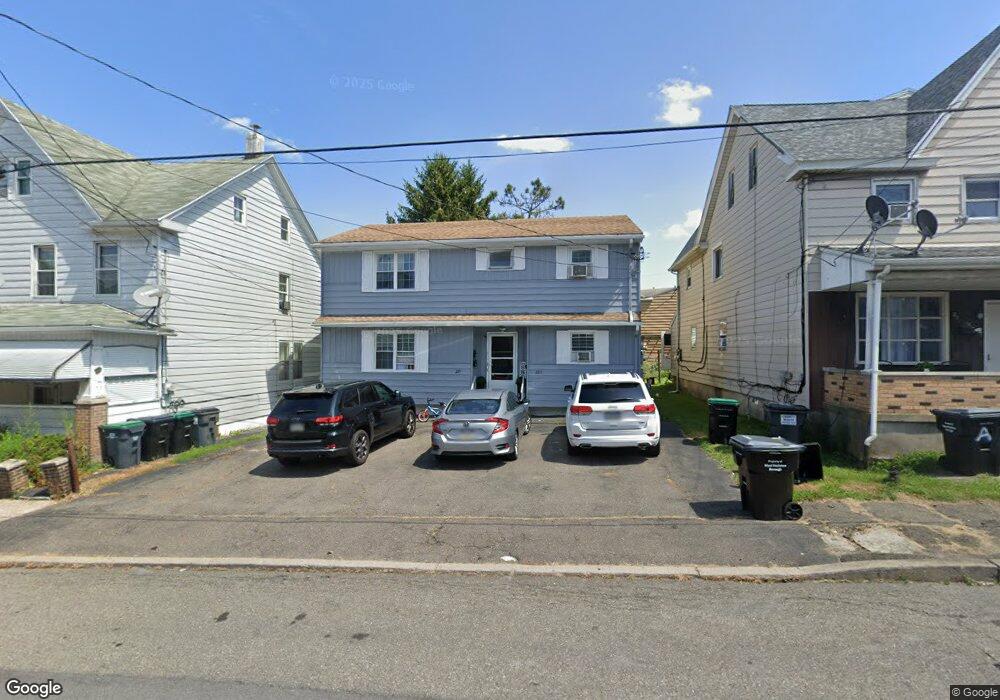
223 Allen St West Hazleton, PA 18202
Estimated Value: $204,000 - $251,000
--
Bed
--
Bath
2,030
Sq Ft
$112/Sq Ft
Est. Value
About This Home
This home is located at 223 Allen St, West Hazleton, PA 18202 and is currently estimated at $228,348, approximately $112 per square foot. 223 Allen St is a home located in Luzerne County with nearby schools including Hazleton Area High School, Immanuel Christian School, and Bishop Hafey Junior/Senior High School.
Ownership History
Date
Name
Owned For
Owner Type
Purchase Details
Closed on
Jan 20, 2022
Sold by
Craig Neil A and Craig Rosalie
Bought by
Medina Silvia C Andujar
Current Estimated Value
Home Financials for this Owner
Home Financials are based on the most recent Mortgage that was taken out on this home.
Original Mortgage
$186,459
Outstanding Balance
$171,845
Interest Rate
3.11%
Mortgage Type
FHA
Estimated Equity
$56,503
Purchase Details
Closed on
Jan 10, 2006
Sold by
Tristani Joseph and Tristani Binnie A
Bought by
Craig Neil A and Craig Rosalie
Create a Home Valuation Report for This Property
The Home Valuation Report is an in-depth analysis detailing your home's value as well as a comparison with similar homes in the area
Home Values in the Area
Average Home Value in this Area
Purchase History
| Date | Buyer | Sale Price | Title Company |
|---|---|---|---|
| Medina Silvia C Andujar | $189,900 | Covenant Abstract | |
| Medina Silvia C Andujar | $189,900 | Covenant Abstract | |
| Craig Neil A | $135,000 | None Available |
Source: Public Records
Mortgage History
| Date | Status | Borrower | Loan Amount |
|---|---|---|---|
| Open | Medina Silvia C Andujar | $186,459 | |
| Closed | Medina Silvia C Andujar | $186,459 |
Source: Public Records
Tax History Compared to Growth
Tax History
| Year | Tax Paid | Tax Assessment Tax Assessment Total Assessment is a certain percentage of the fair market value that is determined by local assessors to be the total taxable value of land and additions on the property. | Land | Improvement |
|---|---|---|---|---|
| 2025 | $4,217 | $167,200 | $20,100 | $147,100 |
| 2024 | $4,078 | $167,200 | $20,100 | $147,100 |
| 2023 | $3,973 | $167,200 | $20,100 | $147,100 |
| 2022 | $3,942 | $167,200 | $20,100 | $147,100 |
| 2021 | $3,845 | $167,200 | $20,100 | $147,100 |
| 2020 | $3,790 | $167,200 | $20,100 | $147,100 |
| 2019 | $3,496 | $167,200 | $20,100 | $147,100 |
| 2018 | $3,387 | $167,200 | $20,100 | $147,100 |
| 2017 | $3,327 | $167,200 | $20,100 | $147,100 |
| 2016 | -- | $167,200 | $20,100 | $147,100 |
| 2015 | -- | $167,200 | $20,100 | $147,100 |
| 2014 | -- | $167,200 | $20,100 | $147,100 |
Source: Public Records
Map
Nearby Homes
- 60 E Jefferson Ave
- 667 Roosevelt St
- 124 Putnam St
- 590 Mckinley St
- 118 E Green St
- 111 S Broad St
- 1 W Diamond Ave
- 307 W Green St
- 609 Landmesser Ave
- 9 Park St
- 756 Peace St
- 328 W Green St
- 31 Park St
- 329 Ridge Ave
- 782 N James St
- 522 N James St
- 536 W Green St
- 1087 N Rear Locust St
- 714 Alter St
- 882 N Locust St