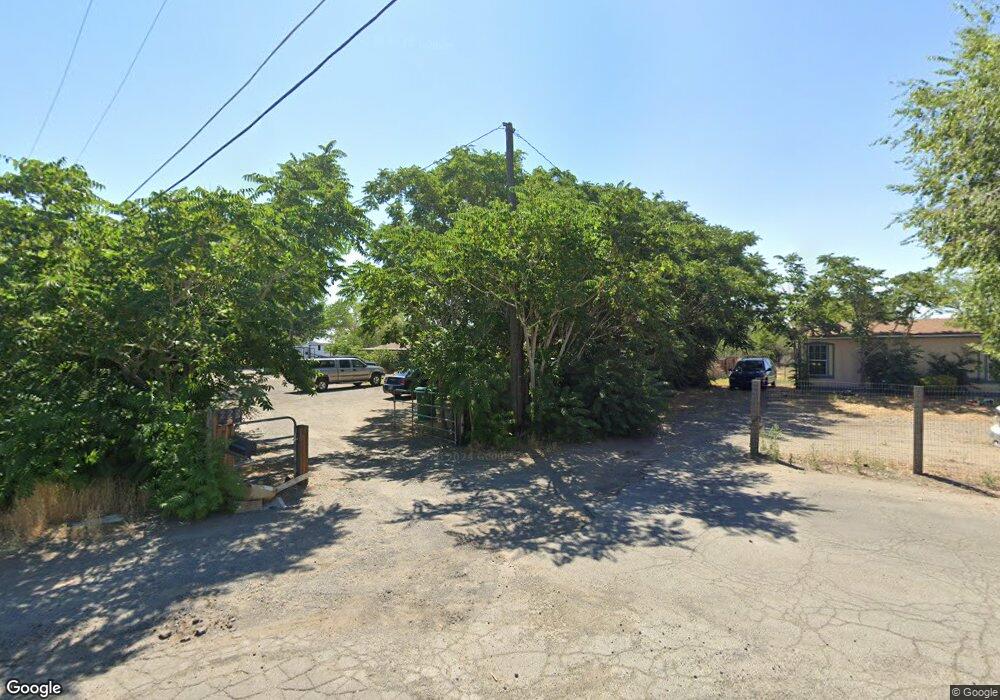
223 Ambee Way Fernley, NV 89408
Estimated Value: $349,000 - $410,000
3
Beds
2
Baths
1,488
Sq Ft
$255/Sq Ft
Est. Value
About This Home
This home is located at 223 Ambee Way, Fernley, NV 89408 and is currently estimated at $379,714, approximately $255 per square foot. 223 Ambee Way is a home located in Lyon County with nearby schools including Fernley Elementary School, Fernley Intermediate School, and Fernley High School.
Ownership History
Date
Name
Owned For
Owner Type
Purchase Details
Closed on
Feb 15, 2011
Sold by
Petersen Nannette and Fair Bobbiann
Bought by
Randall Brandon and Randall Juanita
Current Estimated Value
Home Financials for this Owner
Home Financials are based on the most recent Mortgage that was taken out on this home.
Original Mortgage
$97,000
Outstanding Balance
$66,154
Interest Rate
4.71%
Mortgage Type
Seller Take Back
Estimated Equity
$313,560
Create a Home Valuation Report for This Property
The Home Valuation Report is an in-depth analysis detailing your home's value as well as a comparison with similar homes in the area
Home Values in the Area
Average Home Value in this Area
Purchase History
| Date | Buyer | Sale Price | Title Company |
|---|---|---|---|
| Randall Brandon | $99,000 | Title Service & Escrow Co |
Source: Public Records
Mortgage History
| Date | Status | Borrower | Loan Amount |
|---|---|---|---|
| Open | Randall Brandon | $97,000 |
Source: Public Records
Tax History Compared to Growth
Tax History
| Year | Tax Paid | Tax Assessment Tax Assessment Total Assessment is a certain percentage of the fair market value that is determined by local assessors to be the total taxable value of land and additions on the property. | Land | Improvement |
|---|---|---|---|---|
| 2025 | $1,763 | $102,211 | $47,040 | $55,171 |
| 2024 | $2,121 | $104,888 | $47,040 | $57,848 |
| 2023 | $2,121 | $99,711 | $47,040 | $52,671 |
| 2022 | $1,999 | $93,676 | $47,040 | $46,636 |
| 2021 | $1,978 | $80,183 | $34,980 | $45,203 |
| 2020 | $1,927 | $79,935 | $34,980 | $44,955 |
| 2019 | $1,899 | $78,626 | $34,980 | $43,646 |
| 2018 | $1,860 | $70,104 | $28,000 | $42,104 |
| 2017 | $1,094 | $34,485 | $14,000 | $20,485 |
| 2016 | $921 | $21,688 | $9,450 | $12,238 |
| 2015 | $1,007 | $15,684 | $9,450 | $6,234 |
| 2014 | $936 | $20,916 | $9,450 | $11,466 |
Source: Public Records
Map
Nearby Homes