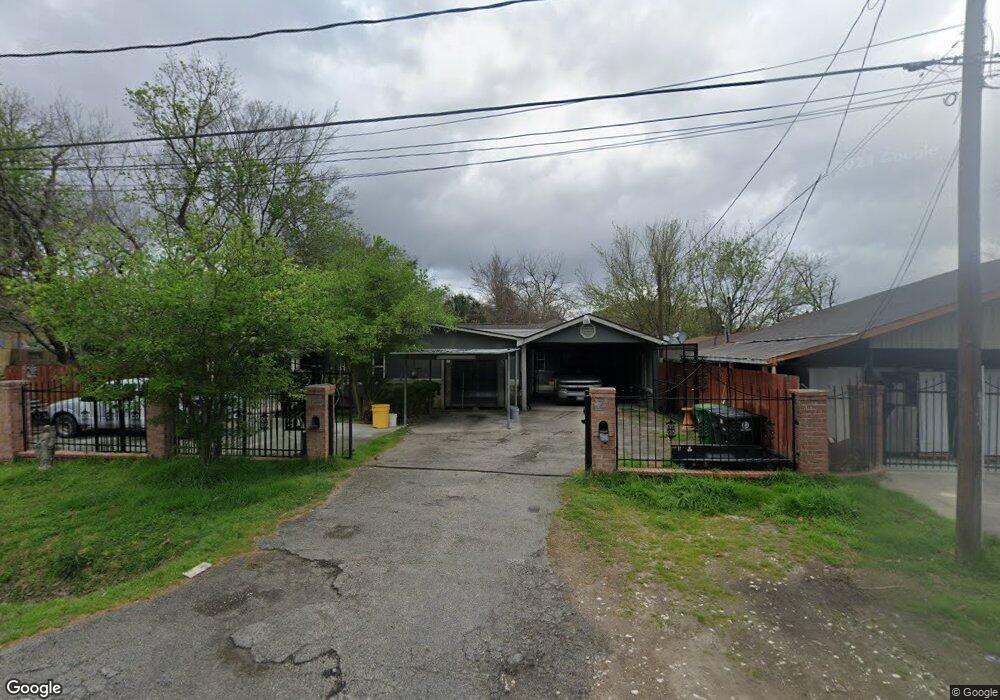
223 Burbank St Houston, TX 77076
Northside-Northline NeighborhoodEstimated Value: $228,000 - $298,000
2
Beds
1
Bath
3,988
Sq Ft
$68/Sq Ft
Est. Value
About This Home
This home is located at 223 Burbank St, Houston, TX 77076 and is currently estimated at $272,558, approximately $68 per square foot. 223 Burbank St is a home located in Harris County with nearby schools including Burbank Elementary School, Burbank Middle School, and Sam Houston Math, Science & Technology Center.
Ownership History
Date
Name
Owned For
Owner Type
Purchase Details
Closed on
Jun 15, 2016
Sold by
Toghani Mehdi
Bought by
Castro Rodney Lgnacio and Sifuentes Rosemary
Current Estimated Value
Purchase Details
Closed on
Jul 7, 2015
Sold by
Navarro Melissa Ann
Bought by
Toghani Mehdi
Purchase Details
Closed on
Jun 27, 2012
Sold by
Navarro Melissa Ann
Bought by
Navarro Santos
Purchase Details
Closed on
Oct 10, 2001
Sold by
Union Planters Pmac Inc
Bought by
Castro Rodney
Purchase Details
Closed on
Jul 6, 1999
Sold by
Navarro Santos and Navarro Rachel
Bought by
Union Planters Pmac Inc and Magna Mtg Company
Create a Home Valuation Report for This Property
The Home Valuation Report is an in-depth analysis detailing your home's value as well as a comparison with similar homes in the area
Home Values in the Area
Average Home Value in this Area
Purchase History
| Date | Buyer | Sale Price | Title Company |
|---|---|---|---|
| Castro Rodney Lgnacio | -- | None Available | |
| Toghani Mehdi | $35,000 | None Available | |
| Navarro Santos | -- | None Available | |
| Castro Rodney | -- | American Title Co | |
| Union Planters Pmac Inc | $27,750 | -- |
Source: Public Records
Tax History Compared to Growth
Tax History
| Year | Tax Paid | Tax Assessment Tax Assessment Total Assessment is a certain percentage of the fair market value that is determined by local assessors to be the total taxable value of land and additions on the property. | Land | Improvement |
|---|---|---|---|---|
| 2025 | $5,930 | $276,094 | $107,276 | $168,818 |
| 2024 | $5,930 | $283,394 | $107,276 | $176,118 |
| 2023 | $5,930 | $284,494 | $103,815 | $180,679 |
| 2022 | $5,000 | $227,097 | $80,745 | $146,352 |
| 2021 | $4,190 | $179,798 | $42,295 | $137,503 |
| 2020 | $4,034 | $166,576 | $42,295 | $124,281 |
| 2019 | $4,164 | $164,554 | $42,295 | $122,259 |
| 2018 | $3,013 | $119,074 | $30,760 | $88,314 |
| 2017 | $3,011 | $119,074 | $30,760 | $88,314 |
| 2016 | $2,835 | $112,116 | $30,760 | $81,356 |
| 2015 | $2,726 | $106,039 | $30,760 | $75,279 |
| 2014 | $2,726 | $106,039 | $30,760 | $75,279 |
Source: Public Records
Map
Nearby Homes
- 219 Heaney Dr
- 202 Burbank St
- 415 Briarcliff Dr
- 9905 Dipping Brook St
- 9907 Dipping Brook St
- 9916 Dipping Woods St
- 9909 Dipping Woods St
- 9920 Dipping Woods St
- 9913 Dipping Woods St
- 9902 Clark Rd Unit D
- 9902 Clark Rd Unit I
- 9902 Clark Rd Unit G
- 9925 Dipping Woods St
- 207 Dipping Stream St
- 283 Turner Dr
- 318 Charlock St
- 9816 Fulton St
- 253 De Boll St
- 249 De Boll St
- 110 Luetta St