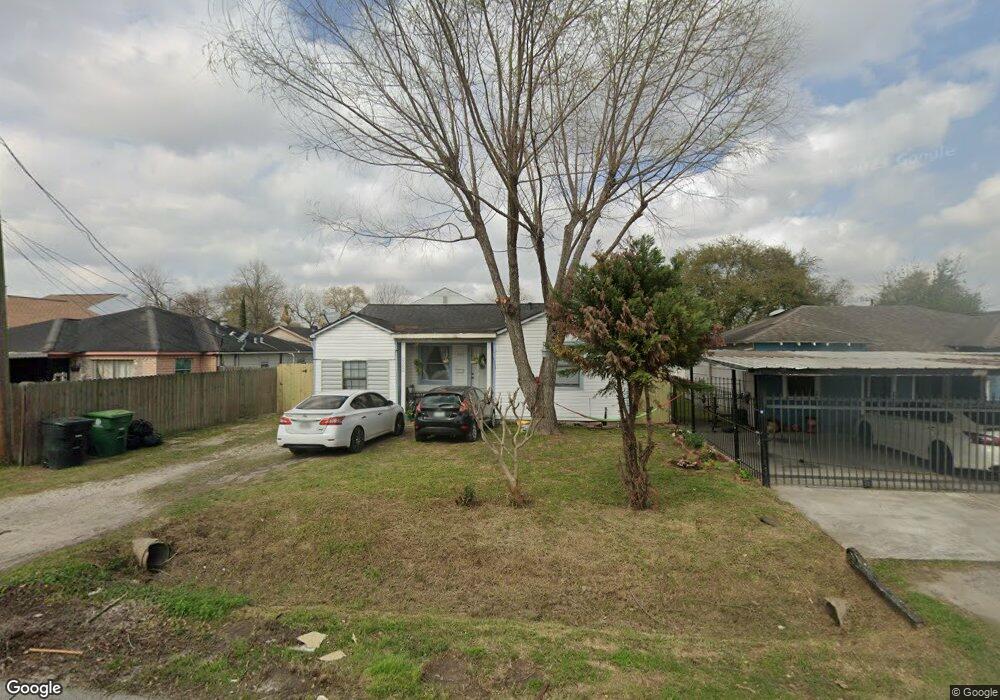
223 Burress St Houston, TX 77022
Northside-Northline NeighborhoodEstimated Value: $173,266 - $287,000
5
Beds
2
Baths
1,753
Sq Ft
$133/Sq Ft
Est. Value
About This Home
This home is located at 223 Burress St, Houston, TX 77022 and is currently estimated at $233,067, approximately $132 per square foot. 223 Burress St is a home located in Harris County with nearby schools including Burbank Elementary School, Burbank Middle School, and Sam Houston Math, Science & Technology Center.
Ownership History
Date
Name
Owned For
Owner Type
Purchase Details
Closed on
Jul 25, 2003
Sold by
Pool Harlan and Nguyen Hien T
Bought by
Reyes Patricia
Current Estimated Value
Home Financials for this Owner
Home Financials are based on the most recent Mortgage that was taken out on this home.
Original Mortgage
$55,000
Outstanding Balance
$23,260
Interest Rate
5.19%
Mortgage Type
Purchase Money Mortgage
Estimated Equity
$209,807
Purchase Details
Closed on
Aug 6, 2002
Sold by
Ancira Herman and Ancira Janie
Bought by
Pool Harlan and Nguyen Hien T
Create a Home Valuation Report for This Property
The Home Valuation Report is an in-depth analysis detailing your home's value as well as a comparison with similar homes in the area
Home Values in the Area
Average Home Value in this Area
Purchase History
| Date | Buyer | Sale Price | Title Company |
|---|---|---|---|
| Reyes Patricia | -- | Fidelity National Title | |
| Pool Harlan | $20,588 | -- |
Source: Public Records
Mortgage History
| Date | Status | Borrower | Loan Amount |
|---|---|---|---|
| Open | Reyes Patricia | $55,000 |
Source: Public Records
Tax History Compared to Growth
Tax History
| Year | Tax Paid | Tax Assessment Tax Assessment Total Assessment is a certain percentage of the fair market value that is determined by local assessors to be the total taxable value of land and additions on the property. | Land | Improvement |
|---|---|---|---|---|
| 2025 | $1,899 | $193,999 | $76,000 | $117,999 |
| 2024 | $1,899 | $185,580 | $69,750 | $115,830 |
| 2023 | $1,899 | $226,487 | $42,500 | $183,987 |
| 2022 | $3,004 | $186,611 | $42,500 | $144,111 |
| 2021 | $2,890 | $147,631 | $42,500 | $105,131 |
| 2020 | $2,730 | $134,361 | $42,500 | $91,861 |
| 2019 | $2,593 | $134,361 | $35,000 | $99,361 |
| 2018 | $1,594 | $107,459 | $29,250 | $78,209 |
| 2017 | $2,142 | $107,459 | $29,250 | $78,209 |
| 2016 | $1,947 | $97,207 | $27,500 | $69,707 |
| 2015 | $1,268 | $70,000 | $20,000 | $50,000 |
| 2014 | $1,268 | $70,000 | $20,000 | $50,000 |
Source: Public Records
Map
Nearby Homes
- 216 Burress St
- 253 De Boll St
- 249 De Boll St
- 318 Charlock St
- 108 Fichter St
- 132 Grothe Ln
- 9026 Mcgallion Rd
- 411 Berry Rd
- 90 Burress St Unit B
- 90 Burress St Unit A
- 88 Berry Rd
- 61 Trenwood Ln
- 702 Pennington St
- 70 Burress St
- 202 Burbank St
- 807 Firnat St
- 56 Wellford St
- 723 Doverside St
- 8205 Appleton St
- 44 Farrell St