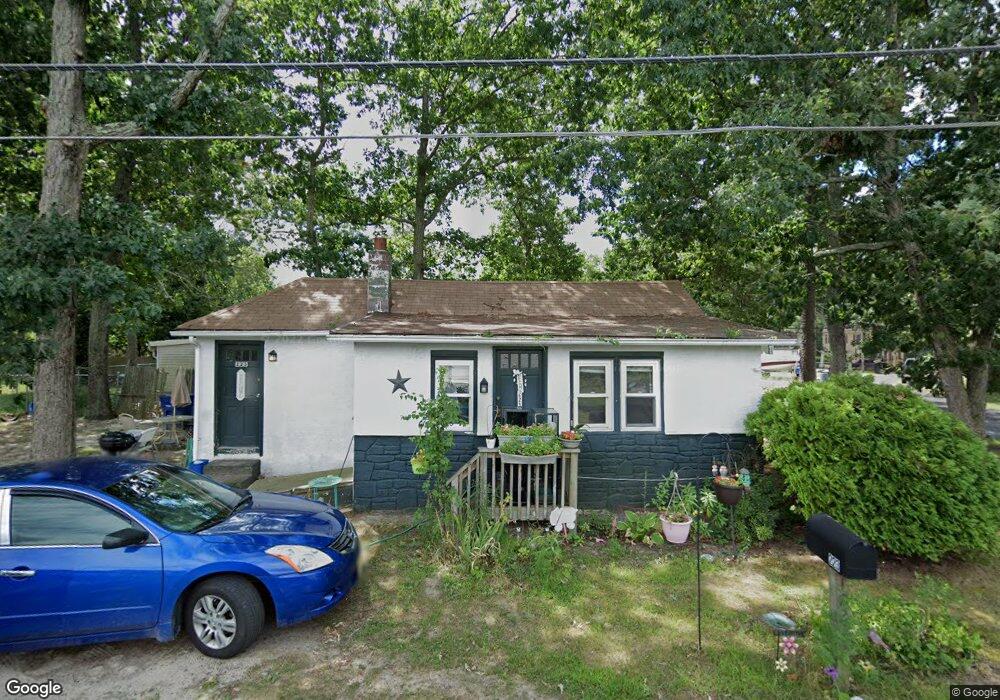
223 Cactus St Browns Mills, NJ 08015
Estimated Value: $135,000 - $253,000
2
Beds
1
Bath
672
Sq Ft
$293/Sq Ft
Est. Value
About This Home
This home is located at 223 Cactus St, Browns Mills, NJ 08015 and is currently estimated at $196,661, approximately $292 per square foot. 223 Cactus St is a home located in Burlington County.
Ownership History
Date
Name
Owned For
Owner Type
Purchase Details
Closed on
Mar 9, 2010
Sold by
Herbst Yvonne M
Bought by
Cook Richard E
Current Estimated Value
Home Financials for this Owner
Home Financials are based on the most recent Mortgage that was taken out on this home.
Original Mortgage
$76,510
Outstanding Balance
$50,760
Interest Rate
5%
Mortgage Type
VA
Estimated Equity
$145,901
Purchase Details
Closed on
Oct 26, 2000
Sold by
Buchanan Bettie
Bought by
Herbst Yvonne M
Purchase Details
Closed on
Jun 18, 1999
Sold by
Ratcliff Kimberly
Bought by
Buchanan Bettie
Home Financials for this Owner
Home Financials are based on the most recent Mortgage that was taken out on this home.
Original Mortgage
$36,000
Interest Rate
7.09%
Purchase Details
Closed on
Dec 24, 1998
Sold by
Hud
Bought by
Ratcliff Kimberly
Purchase Details
Closed on
Apr 20, 1998
Sold by
Wallace Edward G and Wallace Virginia Lee
Bought by
Hud
Create a Home Valuation Report for This Property
The Home Valuation Report is an in-depth analysis detailing your home's value as well as a comparison with similar homes in the area
Home Values in the Area
Average Home Value in this Area
Purchase History
| Date | Buyer | Sale Price | Title Company |
|---|---|---|---|
| Cook Richard E | $74,900 | None Available | |
| Herbst Yvonne M | $47,500 | -- | |
| Buchanan Bettie | $49,900 | Surety Title Corporation | |
| Ratcliff Kimberly | $25,769 | Surety Title Corporation | |
| Hud | -- | -- |
Source: Public Records
Mortgage History
| Date | Status | Borrower | Loan Amount |
|---|---|---|---|
| Open | Cook Richard E | $76,510 | |
| Previous Owner | Buchanan Bettie | $36,000 |
Source: Public Records
Tax History Compared to Growth
Tax History
| Year | Tax Paid | Tax Assessment Tax Assessment Total Assessment is a certain percentage of the fair market value that is determined by local assessors to be the total taxable value of land and additions on the property. | Land | Improvement |
|---|---|---|---|---|
| 2025 | $2,899 | $94,600 | $34,000 | $60,600 |
| 2024 | $2,721 | $94,600 | $34,000 | $60,600 |
| 2023 | $2,721 | $94,600 | $34,000 | $60,600 |
| 2022 | $2,518 | $94,600 | $34,000 | $60,600 |
| 2021 | $2,415 | $94,600 | $34,000 | $60,600 |
| 2020 | $2,324 | $94,600 | $34,000 | $60,600 |
| 2019 | $2,226 | $94,600 | $34,000 | $60,600 |
| 2018 | $2,150 | $94,600 | $34,000 | $60,600 |
| 2017 | $2,106 | $94,600 | $34,000 | $60,600 |
| 2016 | $1,873 | $50,100 | $15,700 | $34,400 |
| 2015 | $1,858 | $50,100 | $15,700 | $34,400 |
| 2014 | $1,776 | $50,100 | $15,700 | $34,400 |
Source: Public Records
Map
Nearby Homes