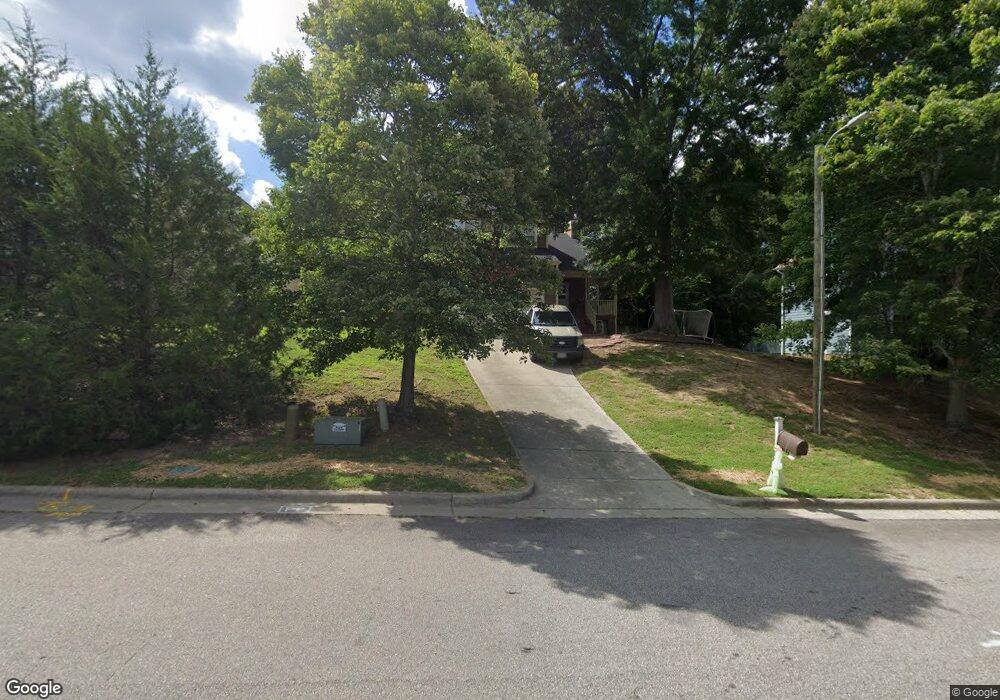
223 Carroll St Wake Forest, NC 27587
Estimated Value: $327,000 - $348,293
3
Beds
3
Baths
1,516
Sq Ft
$223/Sq Ft
Est. Value
About This Home
This home is located at 223 Carroll St, Wake Forest, NC 27587 and is currently estimated at $338,823, approximately $223 per square foot. 223 Carroll St is a home located in Wake County with nearby schools including Richland Creek Elementary School, Wake Forest-Rolesville Middle School, and Wake Forest High School.
Ownership History
Date
Name
Owned For
Owner Type
Purchase Details
Closed on
Aug 9, 2017
Sold by
Alston Marya
Bought by
Sanneh Lamin and Sanneh Kimmie
Current Estimated Value
Home Financials for this Owner
Home Financials are based on the most recent Mortgage that was taken out on this home.
Original Mortgage
$181,649
Outstanding Balance
$153,727
Interest Rate
4.5%
Mortgage Type
FHA
Estimated Equity
$185,096
Purchase Details
Closed on
Nov 25, 1998
Sold by
Blanco William N
Bought by
Alston Marya
Home Financials for this Owner
Home Financials are based on the most recent Mortgage that was taken out on this home.
Original Mortgage
$111,500
Interest Rate
6.95%
Create a Home Valuation Report for This Property
The Home Valuation Report is an in-depth analysis detailing your home's value as well as a comparison with similar homes in the area
Home Values in the Area
Average Home Value in this Area
Purchase History
| Date | Buyer | Sale Price | Title Company |
|---|---|---|---|
| Sanneh Lamin | $185,000 | None Available | |
| Alston Marya | $110,000 | -- |
Source: Public Records
Mortgage History
| Date | Status | Borrower | Loan Amount |
|---|---|---|---|
| Open | Sanneh Lamin | $181,649 | |
| Previous Owner | Alston Marya | $111,500 |
Source: Public Records
Tax History Compared to Growth
Tax History
| Year | Tax Paid | Tax Assessment Tax Assessment Total Assessment is a certain percentage of the fair market value that is determined by local assessors to be the total taxable value of land and additions on the property. | Land | Improvement |
|---|---|---|---|---|
| 2025 | $3,453 | $353,441 | $85,000 | $268,441 |
| 2024 | $3,440 | $353,441 | $85,000 | $268,441 |
| 2023 | $2,379 | $202,988 | $40,000 | $162,988 |
| 2022 | $2,282 | $202,988 | $40,000 | $162,988 |
| 2021 | $2,243 | $202,988 | $40,000 | $162,988 |
| 2020 | $2,243 | $202,988 | $40,000 | $162,988 |
| 2019 | $2,065 | $164,834 | $36,000 | $128,834 |
| 2018 | $1,956 | $164,834 | $36,000 | $128,834 |
| 2017 | $1,891 | $164,834 | $36,000 | $128,834 |
| 2016 | $1,867 | $159,526 | $36,000 | $123,526 |
| 2015 | $1,676 | $145,947 | $28,000 | $117,947 |
| 2014 | $1,622 | $145,947 | $28,000 | $117,947 |
Source: Public Records
Map
Nearby Homes
- 722 E Pine Ave
- 0 Carroll St
- 612 N Allen Rd
- 419 N Allen Rd
- 221 Highgate Cir
- 215 Highgate Cir
- 523 E Nelson Ave
- 609 Summertime Field Ln
- 801 Traditions Ridge Dr
- 413 Pearce Ave
- 153 Deacon Ridge St
- 624 Meadowgrass Ln
- 312 Springtime Fields Ln
- 1019 Tranquil Creek Way
- 506 Oak Forest View Ln
- 518 Oak Forest View Ln
- 1015 Wait Ave
- 103 Ailey Brook Way Unit 200
- 1013 New Creek Way
- 109-200 Ailey Brook Way