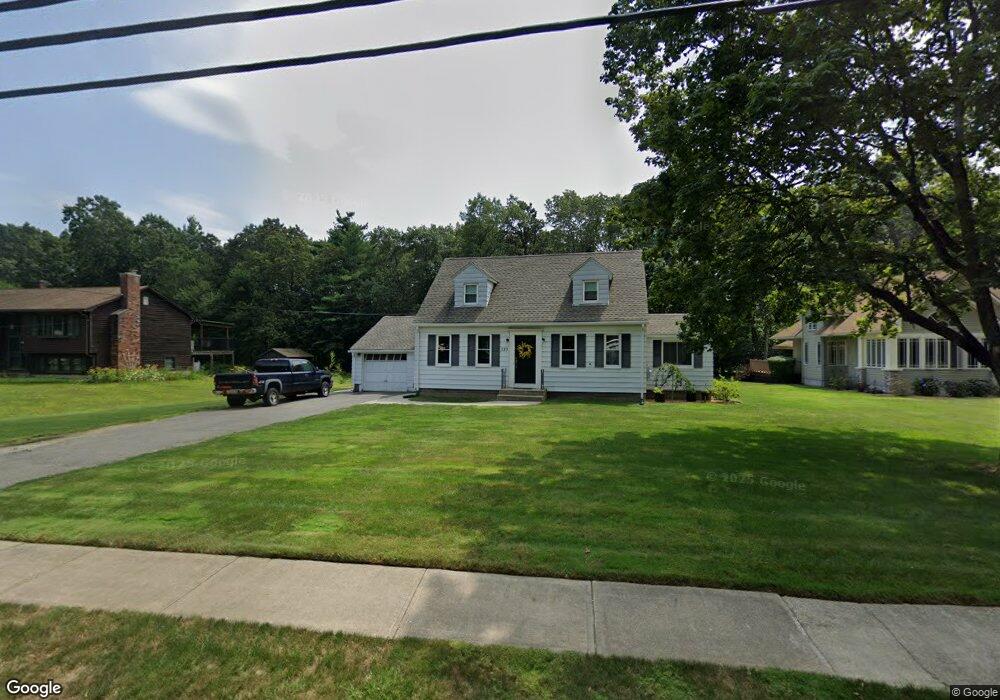
223 Chapin St Ludlow, MA 01056
Estimated Value: $351,159 - $403,000
3
Beds
1
Bath
1,700
Sq Ft
$224/Sq Ft
Est. Value
About This Home
This home is located at 223 Chapin St, Ludlow, MA 01056 and is currently estimated at $380,790, approximately $223 per square foot. 223 Chapin St is a home located in Hampden County with nearby schools including East Street Elementary School, Chapin Street Elementary School, and Paul R. Baird Middle School.
Ownership History
Date
Name
Owned For
Owner Type
Purchase Details
Closed on
Oct 2, 2017
Sold by
Kulig Robert S and Kulig John M
Bought by
Steigmeyer Brian P and Labrecque Aimee E
Current Estimated Value
Home Financials for this Owner
Home Financials are based on the most recent Mortgage that was taken out on this home.
Original Mortgage
$160,000
Outstanding Balance
$133,255
Interest Rate
3.89%
Mortgage Type
New Conventional
Estimated Equity
$247,535
Create a Home Valuation Report for This Property
The Home Valuation Report is an in-depth analysis detailing your home's value as well as a comparison with similar homes in the area
Home Values in the Area
Average Home Value in this Area
Purchase History
| Date | Buyer | Sale Price | Title Company |
|---|---|---|---|
| Steigmeyer Brian P | $200,000 | -- | |
| Steigmeyer Brian P | $200,000 | -- |
Source: Public Records
Mortgage History
| Date | Status | Borrower | Loan Amount |
|---|---|---|---|
| Open | Steigmeyer Brian P | $160,000 | |
| Closed | Steigmeyer Brian P | $160,000 |
Source: Public Records
Tax History
| Year | Tax Paid | Tax Assessment Tax Assessment Total Assessment is a certain percentage of the fair market value that is determined by local assessors to be the total taxable value of land and additions on the property. | Land | Improvement |
|---|---|---|---|---|
| 2025 | $5,052 | $291,200 | $67,500 | $223,700 |
| 2024 | $4,850 | $268,100 | $67,400 | $200,700 |
| 2023 | $4,497 | $230,500 | $56,100 | $174,400 |
| 2022 | $4,228 | $211,500 | $56,100 | $155,400 |
| 2021 | $4,203 | $199,400 | $56,100 | $143,300 |
| 2020 | $4,023 | $195,100 | $55,200 | $139,900 |
| 2019 | $3,352 | $169,100 | $54,700 | $114,400 |
| 2018 | $3,131 | $164,700 | $54,700 | $110,000 |
| 2017 | $3,004 | $162,100 | $55,700 | $106,400 |
| 2016 | $2,845 | $156,900 | $54,600 | $102,300 |
| 2015 | $2,668 | $154,300 | $54,000 | $100,300 |
Source: Public Records
Map
Nearby Homes
- 25 Dale St
- 229 Miller St Unit F-13
- 229 Miller St Unit C-1
- 229 Miller St Unit G-3
- 4 Hillcrest Dr
- 308 Miller St Unit 79
- 308 Miller St Unit 78
- 308 Miller St Unit 6
- 46 Washington Rd
- 35 Lake Dr
- 3 Mohawk St
- 2205 Boston Rd Unit E43
- 2205 Boston Rd Unit M120
- 16 Maple St
- 45 Canterbury St
- 80 Elizabeth Dr
- 36 Maple St
- 24 Lodge Ln Unit 24
- Lot 28 Tower Rd
- 374 East St
- 227 Chapin St
- 219 Chapin St
- 222 Chapin St
- 226 Chapin St
- 213 Chapin St
- 218 Chapin St
- 231 Chapin St
- 214 Chapin St
- 209 Chapin St
- 41 May Rd
- 210 Chapin St
- 31 May Rd
- 49 May Rd
- 23 May Rd
- 206 Chapin St
- 205 Chapin St
- 13 May Rd
- 0 Reynolds St Unit 70879574
- 0 Reynolds St Unit 71486396
- 0 Reynolds St Unit 71898647
Your Personal Tour Guide
Ask me questions while you tour the home.