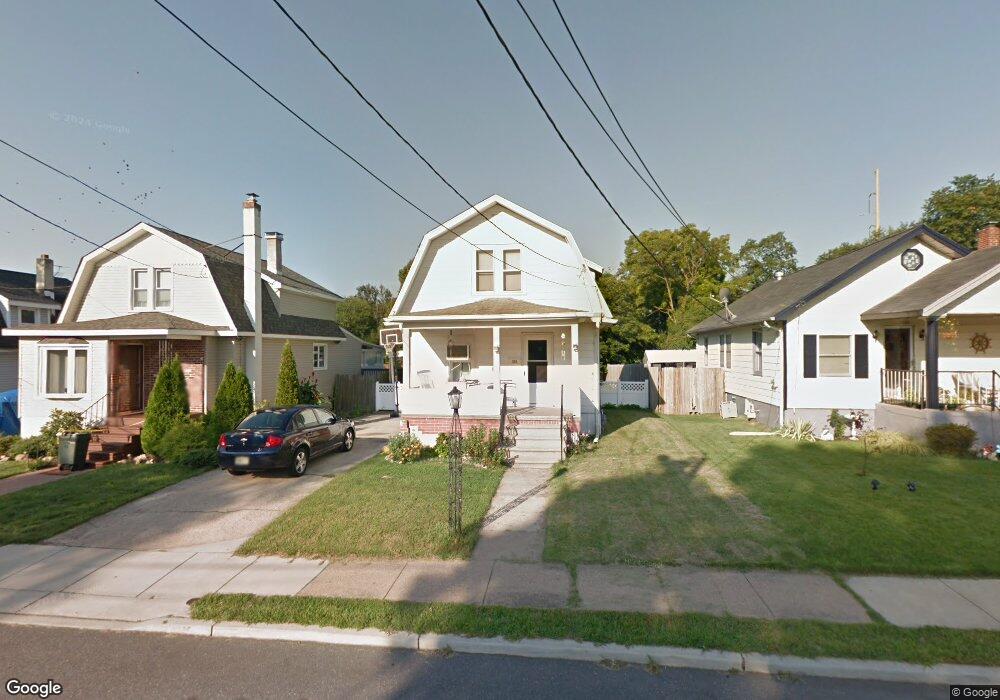
223 Chestnut St Glendora, NJ 08029
Estimated Value: $230,000 - $351,000
2
Beds
2
Baths
1,032
Sq Ft
$278/Sq Ft
Est. Value
About This Home
This home is located at 223 Chestnut St, Glendora, NJ 08029 and is currently estimated at $286,689, approximately $277 per square foot. 223 Chestnut St is a home located in Camden County with nearby schools including Glen Landing Middle School, Triton High School, and St. Teresa Regional School.
Ownership History
Date
Name
Owned For
Owner Type
Purchase Details
Closed on
Jul 11, 2018
Sold by
Midfirst Bank
Bought by
Camden County Properties Llc
Current Estimated Value
Purchase Details
Closed on
Aug 25, 2006
Sold by
Scheffler Gary James
Bought by
Fitzpatrick Brian E and Fitzpatrick Elizabeth
Home Financials for this Owner
Home Financials are based on the most recent Mortgage that was taken out on this home.
Original Mortgage
$168,948
Interest Rate
6.59%
Mortgage Type
FHA
Create a Home Valuation Report for This Property
The Home Valuation Report is an in-depth analysis detailing your home's value as well as a comparison with similar homes in the area
Home Values in the Area
Average Home Value in this Area
Purchase History
| Date | Buyer | Sale Price | Title Company |
|---|---|---|---|
| Camden County Properties Llc | $35,001 | None Available | |
| Fitzpatrick Brian E | $171,600 | -- |
Source: Public Records
Mortgage History
| Date | Status | Borrower | Loan Amount |
|---|---|---|---|
| Previous Owner | Fitzpatrick Brian E | $168,948 |
Source: Public Records
Tax History
| Year | Tax Paid | Tax Assessment Tax Assessment Total Assessment is a certain percentage of the fair market value that is determined by local assessors to be the total taxable value of land and additions on the property. | Land | Improvement |
|---|---|---|---|---|
| 2025 | $6,056 | $143,300 | $46,000 | $97,300 |
| 2024 | $5,854 | $143,300 | $46,000 | $97,300 |
| 2023 | $5,854 | $143,300 | $46,000 | $97,300 |
| 2022 | $5,822 | $143,300 | $46,000 | $97,300 |
| 2021 | $5,700 | $143,300 | $46,000 | $97,300 |
| 2020 | $5,705 | $143,300 | $46,000 | $97,300 |
| 2019 | $5,579 | $143,300 | $46,000 | $97,300 |
| 2018 | $5,554 | $143,300 | $46,000 | $97,300 |
| 2017 | $6,471 | $143,300 | $46,000 | $97,300 |
| 2016 | $5,256 | $143,300 | $46,000 | $97,300 |
| 2015 | $4,879 | $143,300 | $46,000 | $97,300 |
| 2014 | $4,851 | $143,300 | $46,000 | $97,300 |
Source: Public Records
Map
Nearby Homes
- 211 Chestnut St
- 18 E Front St
- 324 Huntington Ave
- 200 Lake Ave
- 239 Lower Landing Rd
- 32 Lake Ave
- 308 Fern Ave
- 535 Main St
- 217 3rd Ave
- 300 3rd Ave
- 200 Austin Ave
- 329 Ridge Ave
- 810 Central Ave
- 1709 Old Black Horse Pike
- 1000 Central Ave
- 535 Roosevelt Ave
- 30 12th Ave
- 1105 Huntington Ave
- 1050 Woodland Ave
- 428 Arline Ave
- 219 Chestnut St
- 227 Chestnut St
- 215 Chestnut St
- 231 Chestnut St
- 235 Chestnut St
- 239 Chestnut St
- 203 Chestnut St
- 220 Chestnut St
- 210 Chestnut St
- 105 E Front St
- 243 Chestnut St
- 202 Chestnut St
- 109 E Front St
- 226 Chestnut St
- 247 Chestnut St
- 200 Chestnut St
- 244 Chestnut St
- 113 E Front St
- 101 E Front St
- 247 Black Horse Pike
Your Personal Tour Guide
Ask me questions while you tour the home.