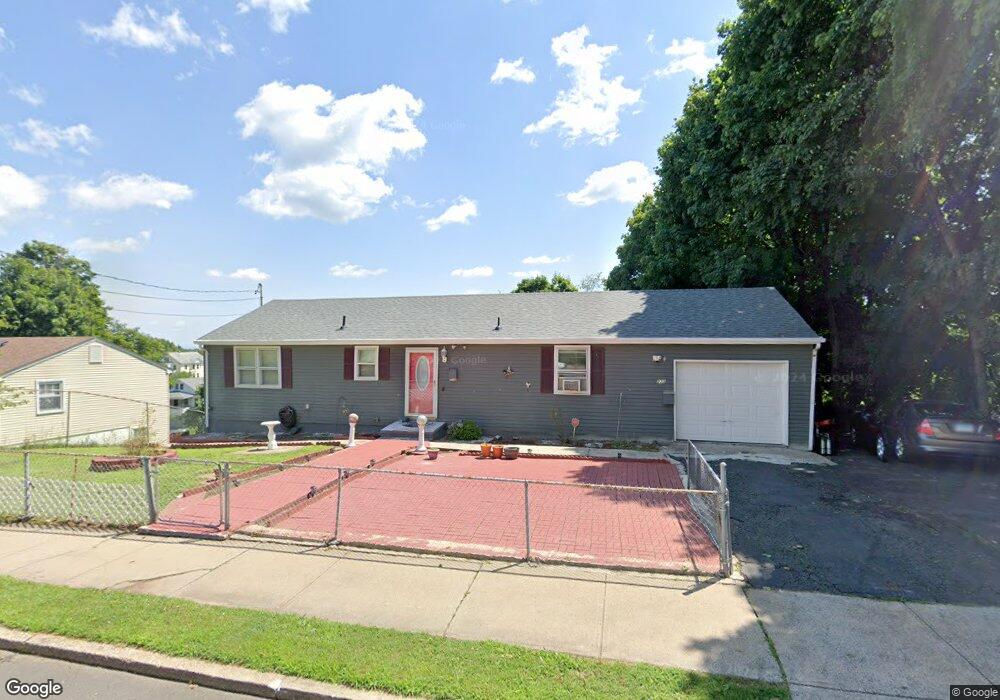
223 Clark St New Britain, CT 06051
Estimated Value: $250,000 - $286,413
2
Beds
1
Bath
1,104
Sq Ft
$239/Sq Ft
Est. Value
About This Home
This home is located at 223 Clark St, New Britain, CT 06051 and is currently estimated at $263,603, approximately $238 per square foot. 223 Clark St is a home located in Hartford County with nearby schools including Smalley Academy, Pulaski Middle School, and Mountain Laurel Sudbury School.
Ownership History
Date
Name
Owned For
Owner Type
Purchase Details
Closed on
Aug 16, 2017
Sold by
Nieves Jose L and Nieves Jose
Bought by
Rodriguez Nannette
Current Estimated Value
Purchase Details
Closed on
May 30, 1995
Sold by
Amsouth Bk Of Florida
Bought by
Nieves Jose L and Rodriquez Nannette
Home Financials for this Owner
Home Financials are based on the most recent Mortgage that was taken out on this home.
Original Mortgage
$74,800
Interest Rate
8.33%
Mortgage Type
Unknown
Purchase Details
Closed on
Apr 27, 1989
Sold by
Weber Richard T
Bought by
Sabino William J
Home Financials for this Owner
Home Financials are based on the most recent Mortgage that was taken out on this home.
Original Mortgage
$132,300
Interest Rate
10.9%
Create a Home Valuation Report for This Property
The Home Valuation Report is an in-depth analysis detailing your home's value as well as a comparison with similar homes in the area
Home Values in the Area
Average Home Value in this Area
Purchase History
| Date | Buyer | Sale Price | Title Company |
|---|---|---|---|
| Rodriguez Nannette | -- | -- | |
| Nieves Jose L | $77,000 | -- | |
| Sabino William J | $147,000 | -- |
Source: Public Records
Mortgage History
| Date | Status | Borrower | Loan Amount |
|---|---|---|---|
| Previous Owner | Sabino William J | $74,800 | |
| Previous Owner | Sabino William J | $132,300 | |
| Previous Owner | Sabino William J | $34,000 |
Source: Public Records
Tax History Compared to Growth
Tax History
| Year | Tax Paid | Tax Assessment Tax Assessment Total Assessment is a certain percentage of the fair market value that is determined by local assessors to be the total taxable value of land and additions on the property. | Land | Improvement |
|---|---|---|---|---|
| 2025 | $5,030 | $128,380 | $50,330 | $78,050 |
| 2024 | $5,083 | $128,380 | $50,330 | $78,050 |
| 2023 | $4,914 | $128,380 | $50,330 | $78,050 |
| 2022 | $3,974 | $80,290 | $16,660 | $63,630 |
| 2021 | $3,974 | $80,290 | $16,660 | $63,630 |
| 2020 | $4,055 | $80,290 | $16,660 | $63,630 |
| 2019 | $4,055 | $80,290 | $16,660 | $63,630 |
| 2018 | $4,055 | $80,290 | $16,660 | $63,630 |
| 2017 | $4,101 | $81,200 | $17,360 | $63,840 |
| 2016 | $4,101 | $81,200 | $17,360 | $63,840 |
| 2015 | $3,979 | $81,200 | $17,360 | $63,840 |
| 2014 | $3,979 | $81,200 | $17,360 | $63,840 |
Source: Public Records
Map
Nearby Homes