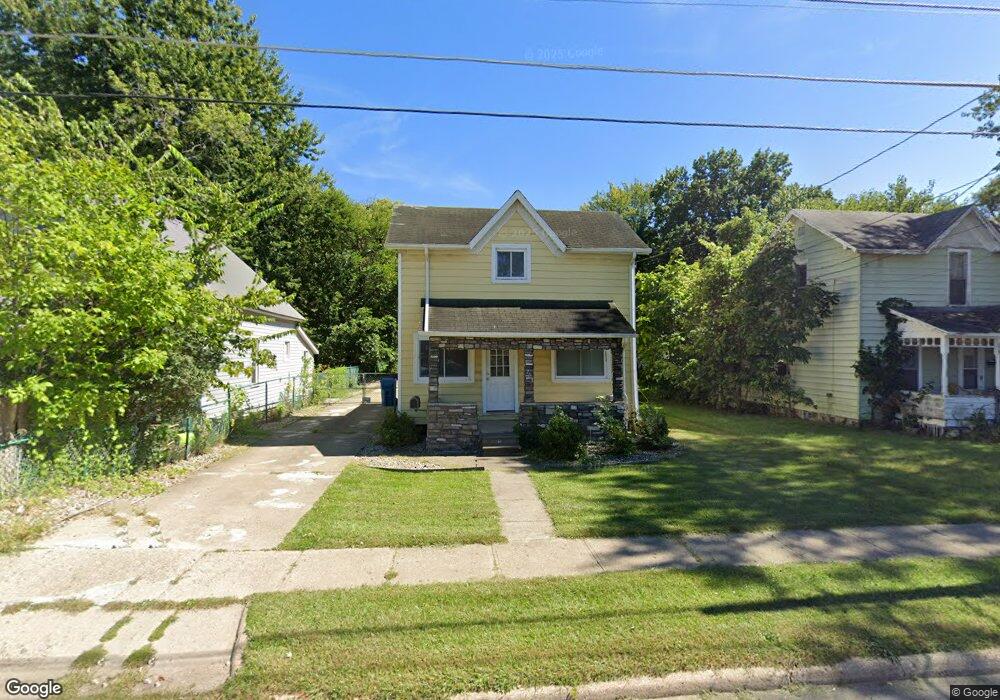
223 Division St Coldwater, MI 49036
Estimated Value: $122,000 - $157,000
3
Beds
1
Bath
6,496
Sq Ft
$21/Sq Ft
Est. Value
About This Home
This home is located at 223 Division St, Coldwater, MI 49036 and is currently estimated at $133,464, approximately $20 per square foot. 223 Division St is a home located in Branch County with nearby schools including Coldwater High School, Pansophia Academy, and St. Charles Borromeo Catholic School.
Ownership History
Date
Name
Owned For
Owner Type
Purchase Details
Closed on
Dec 27, 2018
Sold by
King Investment Property Llc
Bought by
King Melissa
Current Estimated Value
Purchase Details
Closed on
Oct 19, 2006
Sold by
Federal Home Loan Mortgage Corporation
Bought by
King Michael A and King Melissa M
Home Financials for this Owner
Home Financials are based on the most recent Mortgage that was taken out on this home.
Original Mortgage
$28,800
Interest Rate
8.37%
Mortgage Type
Purchase Money Mortgage
Purchase Details
Closed on
Dec 22, 2005
Sold by
Newberry Kendall J and Newberry Anita M
Bought by
Federal Home Loan Mortgage Corporation
Purchase Details
Closed on
Apr 18, 2001
Sold by
Sims Jr Trustee John Charles
Bought by
Newberry Kendall J and Newberry Anita M
Purchase Details
Closed on
May 13, 1993
Sold by
Sims John Charles
Bought by
Sims Jr Trustee John Charles
Create a Home Valuation Report for This Property
The Home Valuation Report is an in-depth analysis detailing your home's value as well as a comparison with similar homes in the area
Home Values in the Area
Average Home Value in this Area
Purchase History
| Date | Buyer | Sale Price | Title Company |
|---|---|---|---|
| King Melissa | -- | None Available | |
| King Michael A | $32,000 | None Available | |
| Federal Home Loan Mortgage Corporation | $34,322 | None Available | |
| Newberry Kendall J | $40,000 | -- | |
| Sims Jr Trustee John Charles | -- | -- |
Source: Public Records
Mortgage History
| Date | Status | Borrower | Loan Amount |
|---|---|---|---|
| Previous Owner | King Michael A | $28,800 |
Source: Public Records
Tax History
| Year | Tax Paid | Tax Assessment Tax Assessment Total Assessment is a certain percentage of the fair market value that is determined by local assessors to be the total taxable value of land and additions on the property. | Land | Improvement |
|---|---|---|---|---|
| 2025 | $1,028 | $39,500 | $0 | $0 |
| 2024 | $10 | $35,050 | $0 | $0 |
| 2023 | $766 | $30,850 | $0 | $0 |
| 2022 | $970 | $26,900 | $0 | $0 |
| 2020 | -- | $20,450 | $0 | $0 |
| 2019 | -- | $19,850 | $0 | $0 |
| 2018 | -- | $17,550 | $0 | $0 |
| 2017 | -- | $17,250 | $0 | $0 |
| 2016 | -- | $17,900 | $0 | $0 |
| 2015 | -- | $19,900 | $0 | $0 |
| 2014 | -- | $18,450 | $0 | $0 |
| 2013 | -- | $14,850 | $0 | $0 |
Source: Public Records
Map
Nearby Homes
Your Personal Tour Guide
Ask me questions while you tour the home.