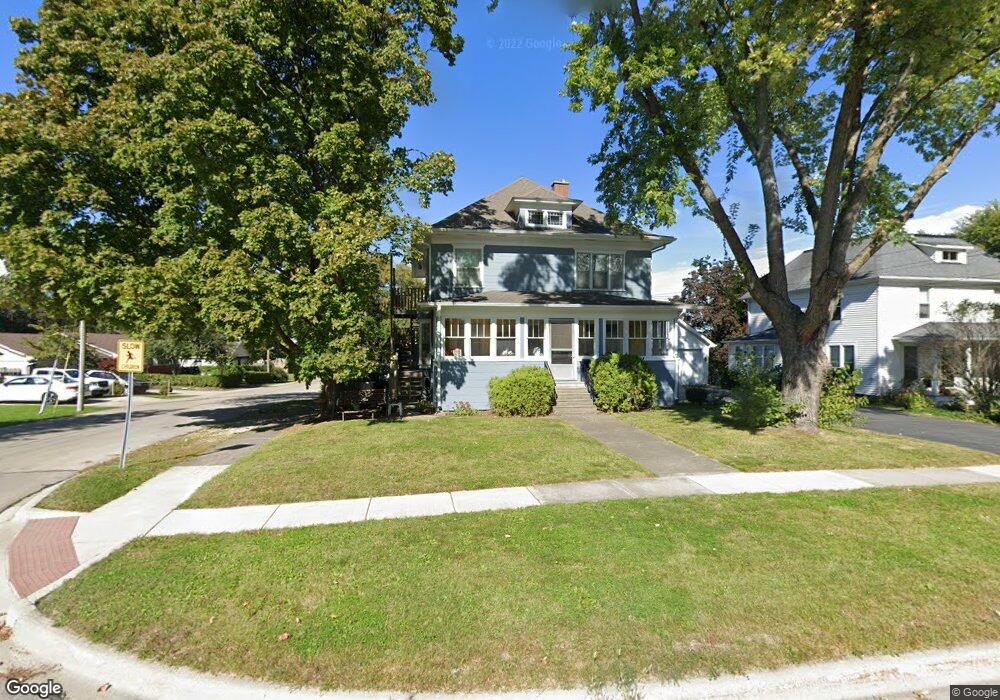
223 E Sycamore St Sycamore, IL 60178
Estimated Value: $197,000 - $264,177
4
Beds
2
Baths
1,074
Sq Ft
$226/Sq Ft
Est. Value
About This Home
This home is located at 223 E Sycamore St, Sycamore, IL 60178 and is currently estimated at $242,544, approximately $225 per square foot. 223 E Sycamore St is a home located in DeKalb County with nearby schools including Sycamore High School, St Mary's Catholic School, and Cornerstone Christian Academy.
Create a Home Valuation Report for This Property
The Home Valuation Report is an in-depth analysis detailing your home's value as well as a comparison with similar homes in the area
Home Values in the Area
Average Home Value in this Area
Tax History
| Year | Tax Paid | Tax Assessment Tax Assessment Total Assessment is a certain percentage of the fair market value that is determined by local assessors to be the total taxable value of land and additions on the property. | Land | Improvement |
|---|---|---|---|---|
| 2024 | $4,761 | $69,679 | $12,307 | $57,372 |
| 2023 | $4,488 | $63,628 | $11,238 | $52,390 |
| 2022 | $4,488 | $58,358 | $10,307 | $48,051 |
| 2021 | $4,707 | $54,786 | $9,676 | $45,110 |
| 2020 | $4,635 | $53,439 | $9,438 | $44,001 |
| 2019 | $4,554 | $52,268 | $9,231 | $43,037 |
| 2018 | $4,468 | $50,682 | $8,951 | $41,731 |
| 2017 | $4,347 | $48,677 | $8,597 | $40,080 |
| 2016 | $4,229 | $46,457 | $8,205 | $38,252 |
| 2015 | -- | $43,724 | $7,722 | $36,002 |
| 2014 | -- | $41,520 | $7,333 | $34,187 |
| 2013 | -- | $42,316 | $7,474 | $34,842 |
Source: Public Records
Map
Nearby Homes
- Lot 1 Route 23
- 1929 Galloway Ct
- 315 North Ave
- 405 W High St
- 335 North Ave
- 356 Home St
- 533 W State St
- 149 Penny Ln
- 45 Briden Ln Unit 45
- 401 E Lincoln St
- 941 Arvle Cir
- 1102 Oxford Cir
- 163 Mclaren Dr N Unit 6F
- 52 Kloe Ln Unit 52
- 122 Mclaren Dr S Unit 1B
- 60 Kloe Ln Unit 60
- 64 Kloe Ln Unit 64
- 429 Fairway Ln
- 326 Edward St
- 1193 Rose Dr
- 220 E Sycamore St
- 212 E Sycamore St
- 235 E Sycamore St
- 318 Plymouth Ct
- 326 Plymouth Ct
- 336 Plymouth Ct
- 311 N Walnut St
- 311 N Walnut St
- 324 N Walnut St
- 344 Plymouth Ct
- 350 Plymouth Ct
- 316 N Locust St Unit 316
- 322 E Sycamore St
- 304 N Locust St
- 314 N Locust St Unit 314-LL
- 314 N Locust St Unit 314-UPPER
- 312 E Sycamore St
- 320 N Locust St
- 323 Plymouth Ct
Your Personal Tour Guide
Ask me questions while you tour the home.