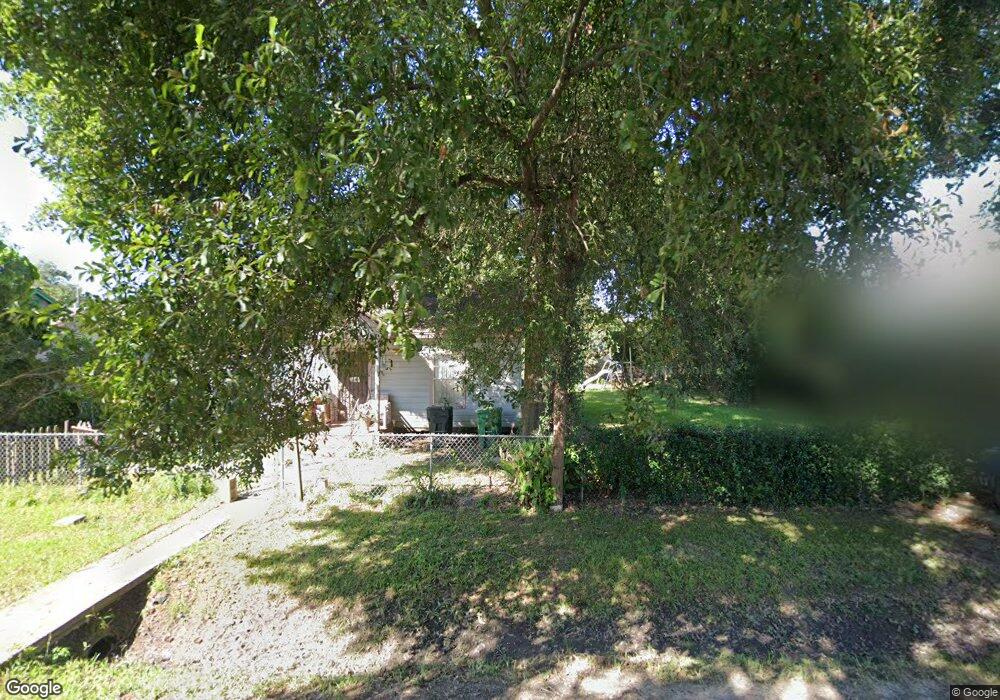
223 Fichter St Houston, TX 77022
Northside-Northline NeighborhoodEstimated Value: $231,000 - $293,000
3
Beds
2
Baths
1,136
Sq Ft
$239/Sq Ft
Est. Value
About This Home
This home is located at 223 Fichter St, Houston, TX 77022 and is currently estimated at $271,798, approximately $239 per square foot. 223 Fichter St is a home located in Harris County with nearby schools including Burbank Elementary School, Burbank Middle School, and Sam Houston Math, Science & Technology Center.
Ownership History
Date
Name
Owned For
Owner Type
Purchase Details
Closed on
May 31, 1996
Sold by
Reyes Marilyn and Inocencio Marilyn
Bought by
Lopez Adrian D
Current Estimated Value
Home Financials for this Owner
Home Financials are based on the most recent Mortgage that was taken out on this home.
Original Mortgage
$30,266
Outstanding Balance
$1,920
Interest Rate
7.92%
Mortgage Type
FHA
Estimated Equity
$269,878
Create a Home Valuation Report for This Property
The Home Valuation Report is an in-depth analysis detailing your home's value as well as a comparison with similar homes in the area
Home Values in the Area
Average Home Value in this Area
Purchase History
| Date | Buyer | Sale Price | Title Company |
|---|---|---|---|
| Lopez Adrian D | -- | -- |
Source: Public Records
Mortgage History
| Date | Status | Borrower | Loan Amount |
|---|---|---|---|
| Open | Lopez Adrian D | $30,266 |
Source: Public Records
Tax History Compared to Growth
Tax History
| Year | Tax Paid | Tax Assessment Tax Assessment Total Assessment is a certain percentage of the fair market value that is determined by local assessors to be the total taxable value of land and additions on the property. | Land | Improvement |
|---|---|---|---|---|
| 2025 | $3,535 | $313,837 | $152,000 | $161,837 |
| 2024 | $3,535 | $272,496 | $139,500 | $132,996 |
| 2023 | $3,535 | $295,495 | $85,000 | $210,495 |
| 2022 | $4,779 | $252,976 | $85,000 | $167,976 |
| 2021 | $2,560 | $139,905 | $85,000 | $54,905 |
| 2020 | $2,418 | $133,386 | $85,000 | $48,386 |
| 2019 | $2,297 | $120,941 | $70,000 | $50,941 |
| 2018 | $1,377 | $99,499 | $58,500 | $40,999 |
| 2017 | $1,897 | $99,499 | $58,500 | $40,999 |
| 2016 | $1,724 | $99,499 | $55,000 | $44,499 |
| 2015 | $1,102 | $62,000 | $30,000 | $32,000 |
| 2014 | $1,102 | $62,000 | $30,000 | $32,000 |
Source: Public Records
Map
Nearby Homes
- 216 Burress St
- 132 Grothe Ln
- 108 Fichter St
- 249 De Boll St
- 253 De Boll St
- 318 Charlock St
- 411 Berry Rd
- 90 Burress St Unit B
- 90 Burress St Unit A
- 9026 Mcgallion Rd
- 61 Trenwood Ln
- 88 Berry Rd
- 70 Burress St
- 56 Wellford St
- 235 Julia St Unit B
- 44 Farrell St
- 8205 Appleton St
- 45 Wellford St
- 240 Julia St Unit D
- 202 Burbank St