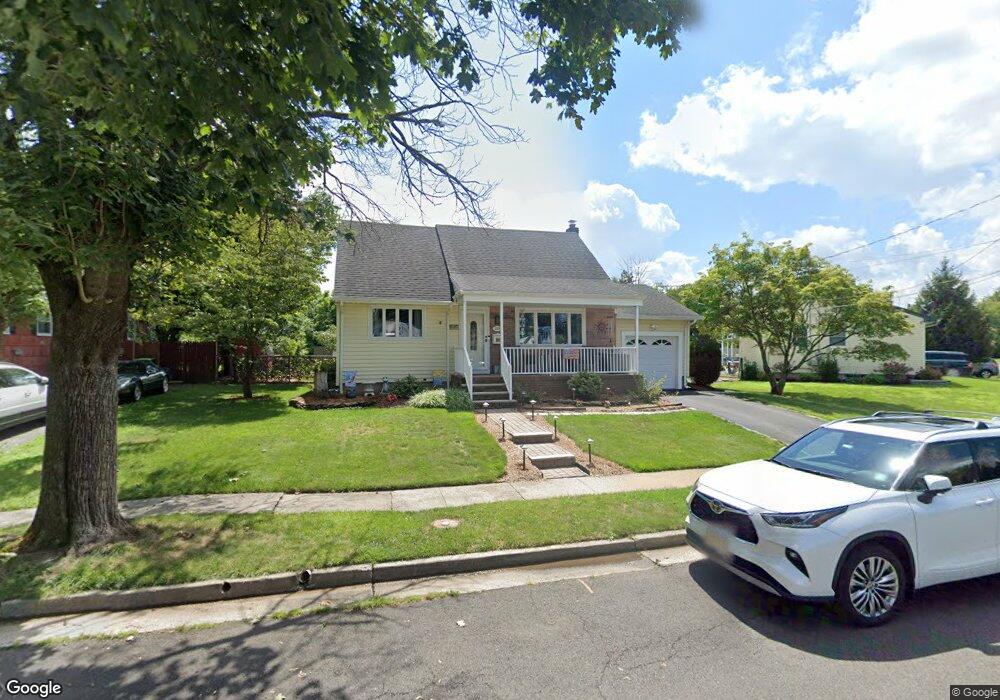
223 Garry St Manville, NJ 08835
Estimated Value: $445,000 - $471,000
--
Bed
--
Bath
1,152
Sq Ft
$398/Sq Ft
Est. Value
About This Home
This home is located at 223 Garry St, Manville, NJ 08835 and is currently estimated at $458,764, approximately $398 per square foot. 223 Garry St is a home located in Somerset County with nearby schools including Weston Elementary School, Roosevelt School, and Alexander Batcho Intermediate School (ABIS).
Ownership History
Date
Name
Owned For
Owner Type
Purchase Details
Closed on
Aug 30, 1995
Sold by
Eurick Dae
Bought by
Doremus Deborah and Auwater Kathleen
Current Estimated Value
Home Financials for this Owner
Home Financials are based on the most recent Mortgage that was taken out on this home.
Original Mortgage
$135,000
Interest Rate
7.8%
Purchase Details
Closed on
Nov 11, 1992
Sold by
First National Bk Of Central Jersey
Bought by
Acedansky Orest and Acedansky Lucille A
Purchase Details
Closed on
Jun 18, 1992
Sold by
Acedanky Orest and Acedanky Lucille A
Bought by
Eurick David E and Eurick Paula M
Create a Home Valuation Report for This Property
The Home Valuation Report is an in-depth analysis detailing your home's value as well as a comparison with similar homes in the area
Home Values in the Area
Average Home Value in this Area
Purchase History
| Date | Buyer | Sale Price | Title Company |
|---|---|---|---|
| Doremus Deborah | $150,000 | -- | |
| Acedansky Orest | -- | -- | |
| Eurick David E | $138,000 | -- |
Source: Public Records
Mortgage History
| Date | Status | Borrower | Loan Amount |
|---|---|---|---|
| Closed | Doremus Deborah | $135,000 |
Source: Public Records
Tax History Compared to Growth
Tax History
| Year | Tax Paid | Tax Assessment Tax Assessment Total Assessment is a certain percentage of the fair market value that is determined by local assessors to be the total taxable value of land and additions on the property. | Land | Improvement |
|---|---|---|---|---|
| 2025 | $8,513 | $408,700 | $227,000 | $181,700 |
| 2024 | $8,513 | $378,200 | $197,000 | $181,200 |
| 2023 | $8,748 | $363,900 | $187,000 | $176,900 |
| 2022 | $8,795 | $336,200 | $167,000 | $169,200 |
| 2021 | $8,297 | $280,600 | $127,000 | $153,600 |
| 2020 | $8,238 | $261,600 | $115,000 | $146,600 |
| 2019 | $8,148 | $249,400 | $115,000 | $134,400 |
| 2018 | $8,224 | $251,500 | $115,000 | $136,500 |
| 2017 | $8,147 | $253,500 | $117,000 | $136,500 |
| 2016 | $7,853 | $253,500 | $117,000 | $136,500 |
| 2015 | $7,585 | $313,800 | $174,000 | $139,800 |
| 2014 | $7,434 | $313,800 | $174,000 | $139,800 |
Source: Public Records
Map
Nearby Homes