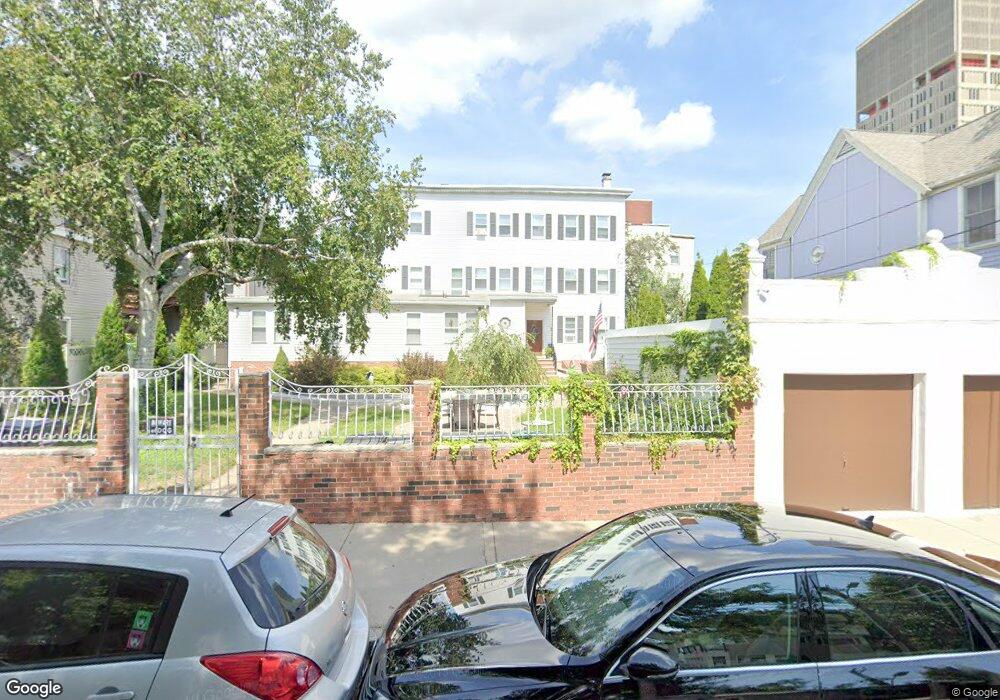
223 Hurley St Unit 2 Cambridge, MA 02141
East Cambridge NeighborhoodEstimated Value: $831,000 - $1,063,000
3
Beds
1
Bath
1,100
Sq Ft
$838/Sq Ft
Est. Value
About This Home
This home is located at 223 Hurley St Unit 2, Cambridge, MA 02141 and is currently estimated at $921,630, approximately $837 per square foot. 223 Hurley St Unit 2 is a home located in Middlesex County with nearby schools including Prospect Hill Academy Charter School and Community Charter School of Cambridge.
Ownership History
Date
Name
Owned For
Owner Type
Purchase Details
Closed on
Sep 8, 2008
Sold by
Vellucci Laura M and Vellucci Peter A
Bought by
Vellucci Peter A
Current Estimated Value
Home Financials for this Owner
Home Financials are based on the most recent Mortgage that was taken out on this home.
Original Mortgage
$290,000
Outstanding Balance
$194,452
Interest Rate
6.69%
Mortgage Type
Purchase Money Mortgage
Estimated Equity
$727,178
Create a Home Valuation Report for This Property
The Home Valuation Report is an in-depth analysis detailing your home's value as well as a comparison with similar homes in the area
Home Values in the Area
Average Home Value in this Area
Purchase History
| Date | Buyer | Sale Price | Title Company |
|---|---|---|---|
| Vellucci Peter A | $390,000 | -- |
Source: Public Records
Mortgage History
| Date | Status | Borrower | Loan Amount |
|---|---|---|---|
| Open | Vellucci Peter A | $290,000 |
Source: Public Records
Tax History Compared to Growth
Tax History
| Year | Tax Paid | Tax Assessment Tax Assessment Total Assessment is a certain percentage of the fair market value that is determined by local assessors to be the total taxable value of land and additions on the property. | Land | Improvement |
|---|---|---|---|---|
| 2025 | $4,070 | $641,000 | $0 | $641,000 |
| 2024 | $3,762 | $635,500 | $0 | $635,500 |
| 2023 | $3,612 | $616,400 | $0 | $616,400 |
| 2022 | $3,598 | $607,700 | $0 | $607,700 |
| 2021 | $3,522 | $602,000 | $0 | $602,000 |
| 2020 | $3,386 | $588,800 | $0 | $588,800 |
| 2019 | $3,241 | $545,600 | $0 | $545,600 |
| 2018 | $3,146 | $500,100 | $0 | $500,100 |
| 2017 | $2,998 | $462,000 | $0 | $462,000 |
| 2016 | $2,917 | $417,300 | $0 | $417,300 |
| 2015 | $2,854 | $364,900 | $0 | $364,900 |
| 2014 | $2,746 | $327,700 | $0 | $327,700 |
Source: Public Records
Map
Nearby Homes
- 133 Charles St Unit 133
- 76-78 Thorndike St
- 50 Spring St
- 95 2nd St Unit 3
- 30 2nd St Unit 2
- 30 2nd St Unit 1
- 30 2nd St Unit 1 & 2
- 68 Gore St
- 36 Sciarappa St
- 17 Otis St Unit 602
- 25 6th St
- 59 7th St Unit 2
- 59 7th St Unit 1
- 59 7th St Unit 3
- 71 Fulkerson St Unit 206
- 170 Gore St Unit 502
- 170 Gore St Unit 113
- 10 Rogers St Unit 308
- 10 Rogers St Unit 415
- 10 Rogers St Unit 231
- 223 Hurley St Unit 3
- 223 Hurley St Unit 1
- 223 Hurley St
- 223 Hurley St Unit B
- 229 Hurley St Unit 3
- 229 Hurley St Unit 2
- 229 Hurley St Unit 1
- 213 Hurley St
- 227 Hurley St Unit 3
- 227 Hurley St Unit 2
- 227 Hurley St Unit 1
- 227 Hurley St
- 227 Hurley St Unit 2,227
- 106 Sciarappa St
- 106 Sciarappa St
- 106 Sciarappa St Unit 105 - 1R
- 106 Sciarappa St Unit 1R
- 235 Hurley St
- 235 Hurley St Unit 1
- 110 Sciarappa St