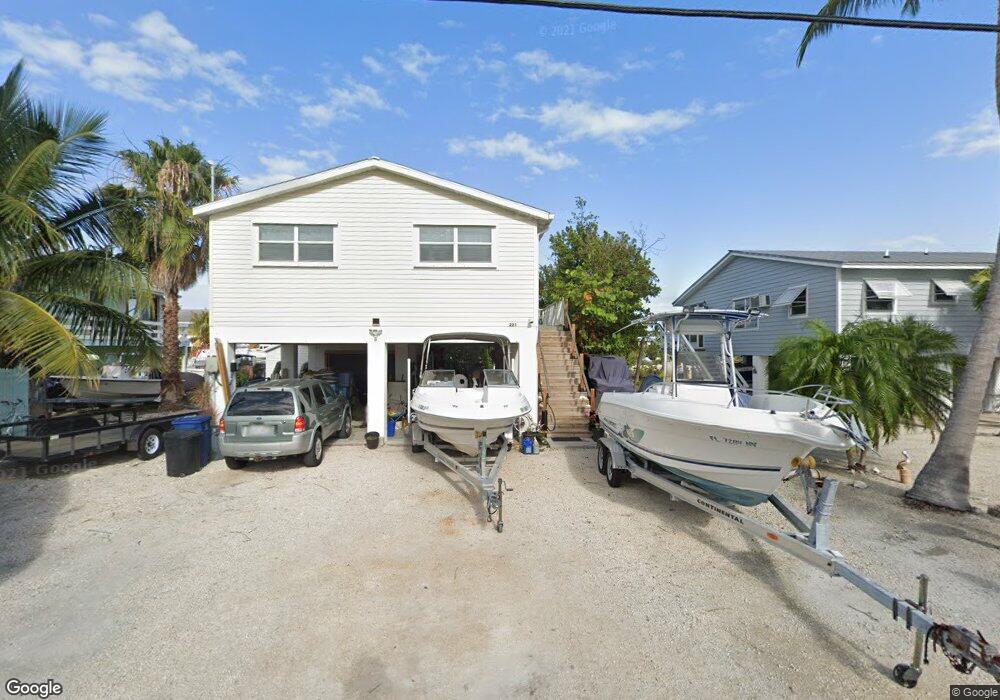
223 Indies Rd Summerland Key, FL 33042
Estimated Value: $794,874 - $971,000
3
Beds
2
Baths
1,214
Sq Ft
$738/Sq Ft
Est. Value
About This Home
This home is located at 223 Indies Rd, Summerland Key, FL 33042 and is currently estimated at $895,469, approximately $737 per square foot. 223 Indies Rd is a home located in Monroe County with nearby schools including Sugarloaf School, Key West High School, and Big Pine Academy.
Ownership History
Date
Name
Owned For
Owner Type
Purchase Details
Closed on
Apr 9, 2015
Sold by
Thompson Ian
Bought by
Robbins Dall Jason J and Robbins Dall Deana
Current Estimated Value
Home Financials for this Owner
Home Financials are based on the most recent Mortgage that was taken out on this home.
Original Mortgage
$403,492
Outstanding Balance
$312,969
Interest Rate
3.95%
Mortgage Type
VA
Estimated Equity
$582,500
Purchase Details
Closed on
Jan 4, 2007
Sold by
Thompson Ian and Parente Lesley A
Bought by
Thompson Ian
Purchase Details
Closed on
Jul 26, 2005
Sold by
Ryan Thomas D and Ryan Carrie
Bought by
Thompson Ian and Parente Lesley A
Purchase Details
Closed on
Jul 8, 2003
Sold by
Whitmore Clifton
Bought by
Ryan Thomas D and Ryan Carrie
Purchase Details
Closed on
Jul 1, 1982
Bought by
Dall Jason J and Dall Deana Robbins
Create a Home Valuation Report for This Property
The Home Valuation Report is an in-depth analysis detailing your home's value as well as a comparison with similar homes in the area
Home Values in the Area
Average Home Value in this Area
Purchase History
| Date | Buyer | Sale Price | Title Company |
|---|---|---|---|
| Robbins Dall Jason J | $395,000 | Palmetto Park Title Svcs Inc | |
| Thompson Ian | -- | S & S Title Partners | |
| Thompson Ian | $559,000 | True Title Agency Inc | |
| Ryan Thomas D | $57,000 | Chicago Title Of The Florida | |
| Dall Jason J | $15,000 | -- |
Source: Public Records
Mortgage History
| Date | Status | Borrower | Loan Amount |
|---|---|---|---|
| Open | Robbins Dall Jason J | $403,492 |
Source: Public Records
Tax History Compared to Growth
Tax History
| Year | Tax Paid | Tax Assessment Tax Assessment Total Assessment is a certain percentage of the fair market value that is determined by local assessors to be the total taxable value of land and additions on the property. | Land | Improvement |
|---|---|---|---|---|
| 2024 | $5,994 | $732,005 | $486,000 | $246,005 |
| 2023 | $5,994 | $727,789 | $492,000 | $235,789 |
| 2022 | $5,511 | $655,160 | $414,000 | $241,160 |
| 2021 | $4,947 | $463,109 | $252,000 | $211,109 |
| 2020 | $4,389 | $398,309 | $228,000 | $170,309 |
| 2019 | $4,268 | $383,939 | $211,500 | $172,439 |
| 2018 | $4,472 | $394,918 | $219,000 | $175,918 |
| 2017 | $4,340 | $385,026 | $0 | $0 |
| 2016 | $4,208 | $360,007 | $0 | $0 |
| 2015 | $3,883 | $313,561 | $0 | $0 |
| 2014 | -- | $314,107 | $0 | $0 |
Source: Public Records
Map
Nearby Homes
- 27350 Barbados Ln
- 27405 Guadaloupe Ln
- 27463 Antigua Rd
- 27453 Antigua Rd
- 27332 St Martin Ln
- 27345 Guadaloupe Ln
- 27433 Antigua Rd
- 27314 Saint Lucie Ln
- 231 W Indies Dr
- 281 W Indies Dr
- 27213 Old State Road 4a Unit 4a
- 27417 Tobago Ln
- 27398 Jamaica Ln
- 27038 Angelfish Rd
- 27001 Overseas Hwy
- 27360 Saint Croix Ln
- 681 W Indies Dr
- 711 W Indies Dr
- 643 Indies Rd
- 40 Munson Ave
- 223 W Indies Dr
- 233 Indies Rd
- 213 W Indies Dr
- 243 Indies Rd
- 27309 Saint Vincent Ln
- 27308 Saint Vincent Ln
- 253 Indies Rd
- 183 Indies Rd
- Lot 18 St Vincent Ln
- Lot 18 Saint Vincent Ln
- 263 Indies Rd
- 263 W Indies Dr
- 27306 Martinique Ln
- 27329 St Vincent Ln
- 27328 St Vincent Ln
- 27316 Martinique Ln
- 123 Indies Rd
- 27311 Barbados Ln
- 273 Indies Rd
- LOT 17 Saint Vincent Ln