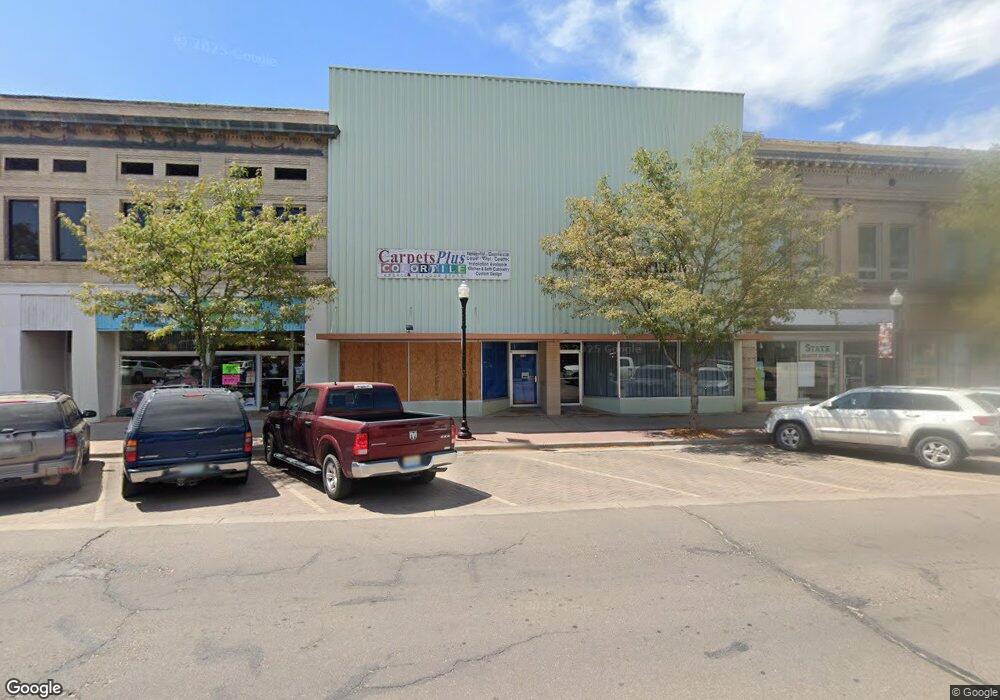
223 Main St Fort Morgan, CO 80701
Estimated Value: $159,400
--
Bed
2
Baths
11,250
Sq Ft
$14/Sq Ft
Est. Value
About This Home
This home is located at 223 Main St, Fort Morgan, CO 80701 and is currently priced at $159,400, approximately $14 per square foot. 223 Main St is a home located in Morgan County with nearby schools including Fort Morgan High School, Trinity Lutheran School, and Lighthouse Seventh-day Adventist Christian School.
Ownership History
Date
Name
Owned For
Owner Type
Purchase Details
Closed on
Mar 12, 2021
Sold by
Heistermann Deborah
Bought by
Barnett Douglas
Current Estimated Value
Home Financials for this Owner
Home Financials are based on the most recent Mortgage that was taken out on this home.
Original Mortgage
$400,000
Outstanding Balance
$360,368
Interest Rate
3%
Mortgage Type
Purchase Money Mortgage
Purchase Details
Closed on
Nov 15, 2019
Sold by
Stieb Charlotte S
Bought by
Heistermann Deborah
Purchase Details
Closed on
Feb 4, 2009
Sold by
Trujillo Frances C and Estate Of Aristio Adam Trujuil
Bought by
Stieb James L and Stieb Charlotte S
Create a Home Valuation Report for This Property
The Home Valuation Report is an in-depth analysis detailing your home's value as well as a comparison with similar homes in the area
Home Values in the Area
Average Home Value in this Area
Purchase History
| Date | Buyer | Sale Price | Title Company |
|---|---|---|---|
| Barnett Douglas | $140,000 | None Available | |
| Heistermann Deborah | $140,000 | None Available | |
| Stieb James L | $142,000 | Nct |
Source: Public Records
Mortgage History
| Date | Status | Borrower | Loan Amount |
|---|---|---|---|
| Open | Barnett Douglas | $400,000 |
Source: Public Records
Tax History Compared to Growth
Tax History
| Year | Tax Paid | Tax Assessment Tax Assessment Total Assessment is a certain percentage of the fair market value that is determined by local assessors to be the total taxable value of land and additions on the property. | Land | Improvement |
|---|---|---|---|---|
| 2024 | $2,468 | $30,820 | $9,670 | $21,150 |
| 2023 | $2,468 | $39,190 | $9,670 | $29,520 |
| 2022 | $3,184 | $38,850 | $10,050 | $28,800 |
| 2021 | $3,188 | $38,850 | $10,050 | $28,800 |
| 2020 | $3,735 | $44,300 | $11,700 | $32,600 |
| 2019 | $3,741 | $44,300 | $11,700 | $32,600 |
| 2018 | $3,520 | $41,080 | $11,040 | $30,040 |
| 2017 | $3,524 | $41,080 | $11,040 | $30,040 |
| 2016 | $3,432 | $39,640 | $10,410 | $29,230 |
| 2015 | $3,383 | $39,640 | $10,410 | $29,230 |
| 2014 | $3,424 | $39,130 | $10,810 | $28,320 |
| 2013 | -- | $39,130 | $10,810 | $28,320 |
Source: Public Records
Map
Nearby Homes