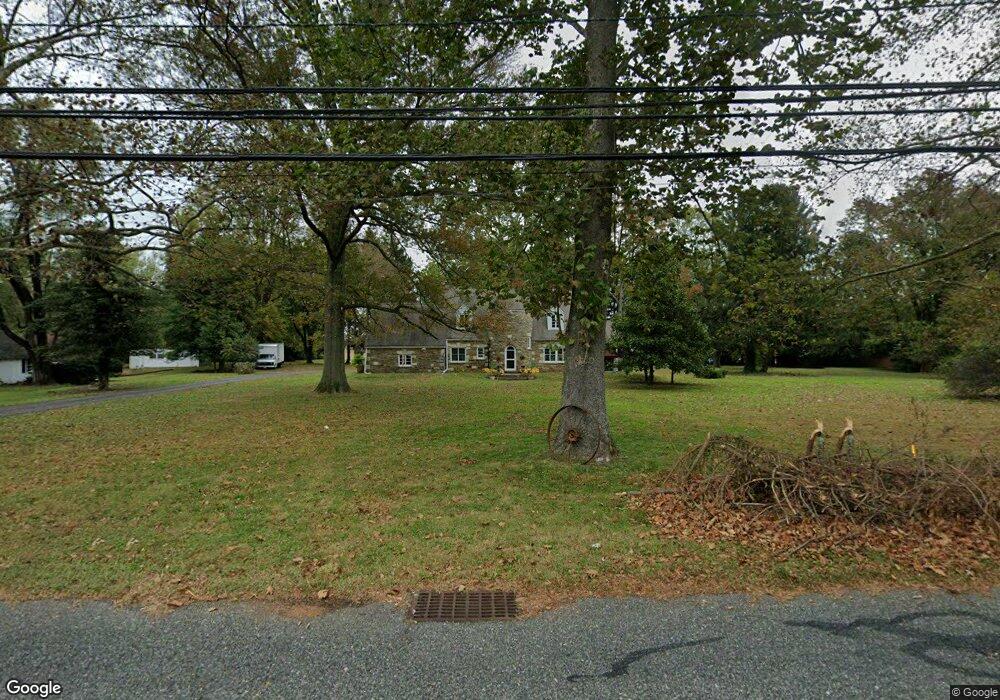
223 Main St Rancocas, NJ 08073
Estimated Value: $403,207 - $473,000
--
Bed
--
Bath
1,991
Sq Ft
$220/Sq Ft
Est. Value
About This Home
This home is located at 223 Main St, Rancocas, NJ 08073 and is currently estimated at $438,302, approximately $220 per square foot. 223 Main St is a home with nearby schools including Holly Hills Elementary School, Westampton Intermediate School, and Rancocas Valley Regional High School.
Ownership History
Date
Name
Owned For
Owner Type
Purchase Details
Closed on
Jun 14, 2017
Sold by
Mathis Andrea L
Bought by
130 Main Llc and Orsuto Arielle
Current Estimated Value
Home Financials for this Owner
Home Financials are based on the most recent Mortgage that was taken out on this home.
Original Mortgage
$345,000
Outstanding Balance
$285,941
Interest Rate
3.89%
Estimated Equity
$152,361
Purchase Details
Closed on
Apr 16, 2003
Sold by
Mathis Mary E
Bought by
Mathis Andrea L
Create a Home Valuation Report for This Property
The Home Valuation Report is an in-depth analysis detailing your home's value as well as a comparison with similar homes in the area
Home Values in the Area
Average Home Value in this Area
Purchase History
| Date | Buyer | Sale Price | Title Company |
|---|---|---|---|
| 130 Main Llc | $345,000 | -- | |
| Mathis Andrea L | -- | -- |
Source: Public Records
Mortgage History
| Date | Status | Borrower | Loan Amount |
|---|---|---|---|
| Open | 130 Main Llc | $345,000 | |
| Closed | 130 Main Llc | -- | |
| Previous Owner | 130 Main Llc | $138,826 |
Source: Public Records
Tax History Compared to Growth
Tax History
| Year | Tax Paid | Tax Assessment Tax Assessment Total Assessment is a certain percentage of the fair market value that is determined by local assessors to be the total taxable value of land and additions on the property. | Land | Improvement |
|---|---|---|---|---|
| 2025 | $7,067 | $251,600 | $87,000 | $164,600 |
| 2024 | $6,801 | $251,600 | $87,000 | $164,600 |
| 2023 | $6,801 | $251,600 | $87,000 | $164,600 |
| 2022 | $6,461 | $251,600 | $87,000 | $164,600 |
| 2021 | $6,222 | $251,600 | $87,000 | $164,600 |
| 2020 | $6,197 | $251,600 | $87,000 | $164,600 |
| 2019 | $6,071 | $251,600 | $87,000 | $164,600 |
| 2018 | $5,993 | $251,600 | $87,000 | $164,600 |
| 2017 | $5,835 | $251,600 | $87,000 | $164,600 |
| 2016 | $5,726 | $251,600 | $87,000 | $164,600 |
| 2015 | $5,616 | $251,600 | $87,000 | $164,600 |
| 2014 | $5,472 | $251,600 | $87,000 | $164,600 |
Source: Public Records
Map
Nearby Homes
- 11 Valley Farm Rd
- 208 2nd St
- 120 Second St
- 126 Olive St
- 67 Triangle Ln
- 80 Ember Ln
- 10 Elderberry Ln
- 7 Nelsons Way
- 24 Elliot Ln
- Delmar Plan at Laurel Run
- 40 Nelsons Way
- 112 Toledo Ln
- 2 Evergreen Ct
- 42 Tipton Ln
- 104 Evergreen Dr
- 69 Alexander Way
- 59 Elliot Ln
- 65 Alexander Way
- 75 Alexander Way
- 73 Alexander Way