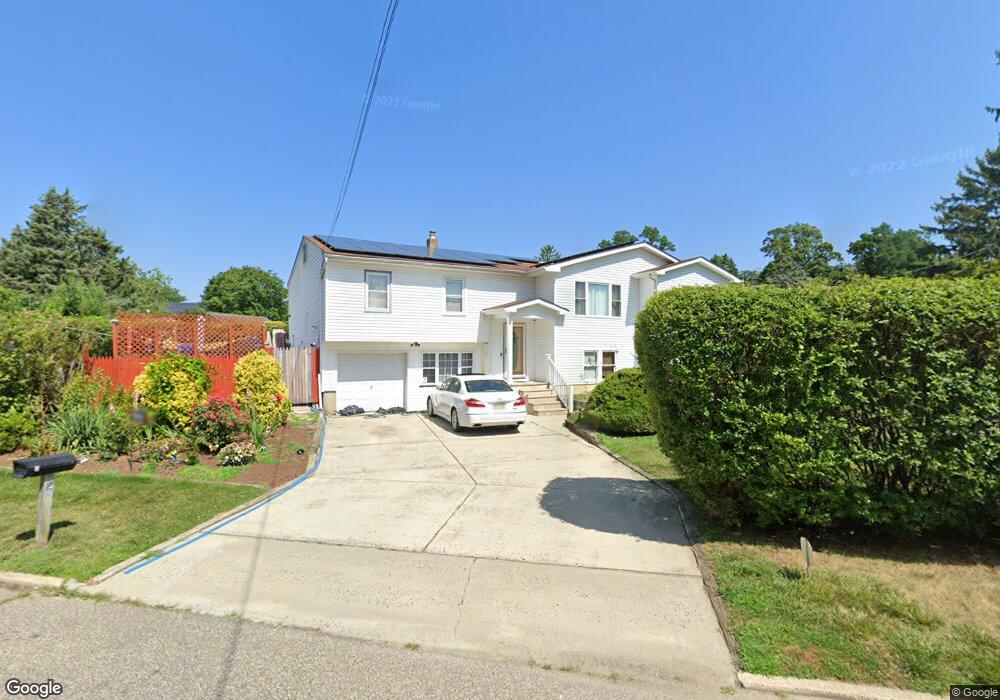
223 Maple Ave Neptune, NJ 07753
Estimated Value: $635,000 - $749,186
4
Beds
2
Baths
2,786
Sq Ft
$253/Sq Ft
Est. Value
About This Home
This home is located at 223 Maple Ave, Neptune, NJ 07753 and is currently estimated at $705,297, approximately $253 per square foot. 223 Maple Ave is a home located in Monmouth County with nearby schools including Neptune High School, Hope Academy Charter School, and Our Lady of Mount Carmel School.
Ownership History
Date
Name
Owned For
Owner Type
Purchase Details
Closed on
Dec 14, 2013
Sold by
Green Collin
Bought by
Myers Catherine
Current Estimated Value
Purchase Details
Closed on
Jan 26, 2009
Sold by
Myres Catherine
Bought by
Myres Catherine and Green Collin
Home Financials for this Owner
Home Financials are based on the most recent Mortgage that was taken out on this home.
Original Mortgage
$369,138
Interest Rate
5.2%
Mortgage Type
FHA
Purchase Details
Closed on
Jun 10, 1996
Sold by
Dafeldeker William
Bought by
Myres Catherine
Home Financials for this Owner
Home Financials are based on the most recent Mortgage that was taken out on this home.
Original Mortgage
$120,000
Interest Rate
8.05%
Mortgage Type
FHA
Create a Home Valuation Report for This Property
The Home Valuation Report is an in-depth analysis detailing your home's value as well as a comparison with similar homes in the area
Home Values in the Area
Average Home Value in this Area
Purchase History
| Date | Buyer | Sale Price | Title Company |
|---|---|---|---|
| Myers Catherine | -- | None Available | |
| Myres Catherine | -- | Fidelity Natl Title Ins Co | |
| Myres Catherine | $134,000 | -- |
Source: Public Records
Mortgage History
| Date | Status | Borrower | Loan Amount |
|---|---|---|---|
| Previous Owner | Myres Catherine | $369,138 | |
| Previous Owner | Myres Catherine | $120,000 |
Source: Public Records
Tax History
| Year | Tax Paid | Tax Assessment Tax Assessment Total Assessment is a certain percentage of the fair market value that is determined by local assessors to be the total taxable value of land and additions on the property. | Land | Improvement |
|---|---|---|---|---|
| 2025 | $10,667 | $652,600 | $270,100 | $382,500 |
| 2024 | $10,168 | $609,200 | $233,700 | $375,500 |
Source: Public Records
Map
Nearby Homes
- 303 Monmouth Ave
- 116 Moss Place
- 608 Wayside Rd
- 701 Fletcher Dr
- 309 Deal Ave
- 16 Phoebe Dr
- 2716 W Bangs Ave
- 634 Wayside Rd
- 10 Hill Dr
- 636 Wayside Rd
- 1 Oak Dr
- 640 Green Grove Rd
- 9 Hillview Dr
- 3 Manor Dr
- 324 Hillside Dr
- 2206 Alpine Trail
- 408 Alpine Trail Unit 408
- 114 Durand Rd
- 20 Kenneth Terrace
- 4 White Dr
Your Personal Tour Guide
Ask me questions while you tour the home.