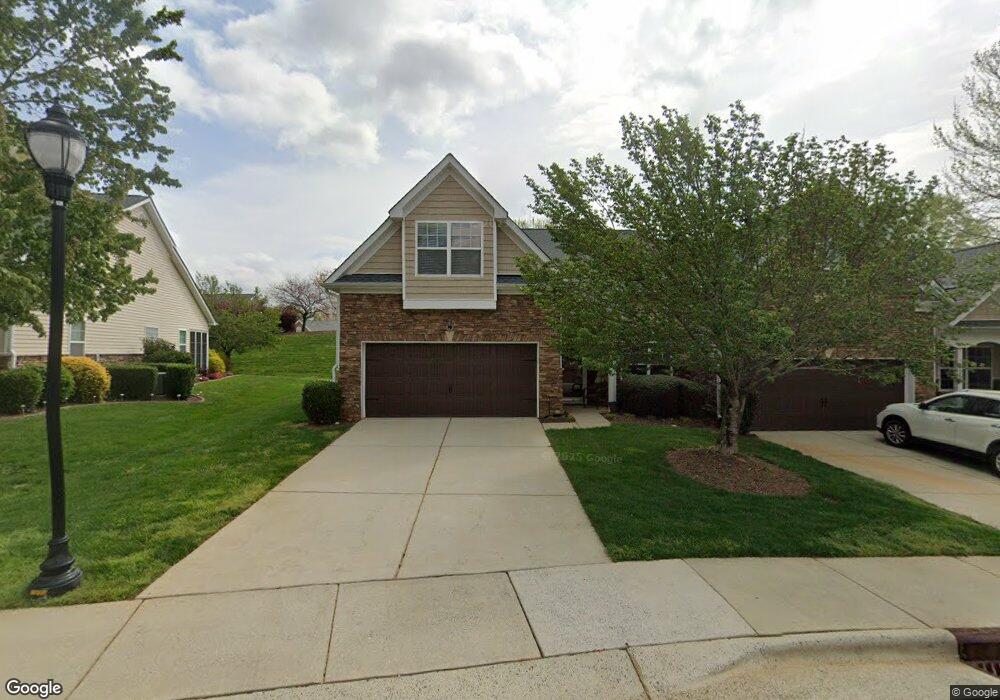
223 Meadow Beauty Dr Unit 160 Apex, NC 27539
Middle Creek NeighborhoodEstimated Value: $460,239 - $476,000
3
Beds
3
Baths
2,225
Sq Ft
$210/Sq Ft
Est. Value
About This Home
This home is located at 223 Meadow Beauty Dr Unit 160, Apex, NC 27539 and is currently estimated at $466,310, approximately $209 per square foot. 223 Meadow Beauty Dr Unit 160 is a home located in Wake County with nearby schools including West Lake Elementary School, West Lake Middle, and Middle Creek High.
Ownership History
Date
Name
Owned For
Owner Type
Purchase Details
Closed on
Jun 30, 2020
Sold by
Hili Cheryl A
Bought by
Cerefice Karen
Current Estimated Value
Home Financials for this Owner
Home Financials are based on the most recent Mortgage that was taken out on this home.
Original Mortgage
$140,000
Outstanding Balance
$124,373
Interest Rate
3.2%
Mortgage Type
New Conventional
Estimated Equity
$341,937
Purchase Details
Closed on
Aug 30, 2019
Sold by
Seidell Carol A
Bought by
Hili Cheryl A and The Seidell Irrevocable Trust
Purchase Details
Closed on
Feb 27, 2008
Sold by
D R Horton Inc
Bought by
Seidell Andrew J and Seidell Carol A
Home Financials for this Owner
Home Financials are based on the most recent Mortgage that was taken out on this home.
Original Mortgage
$167,500
Interest Rate
5.65%
Mortgage Type
Unknown
Create a Home Valuation Report for This Property
The Home Valuation Report is an in-depth analysis detailing your home's value as well as a comparison with similar homes in the area
Home Values in the Area
Average Home Value in this Area
Purchase History
| Date | Buyer | Sale Price | Title Company |
|---|---|---|---|
| Cerefice Karen | $330,000 | Nationwide Ttl Clearing Inc | |
| Hili Cheryl A | -- | None Available | |
| Seidell Andrew J | $257,500 | None Available |
Source: Public Records
Mortgage History
| Date | Status | Borrower | Loan Amount |
|---|---|---|---|
| Open | Cerefice Karen | $140,000 | |
| Previous Owner | Seidell Andrew J | $167,500 |
Source: Public Records
Tax History Compared to Growth
Tax History
| Year | Tax Paid | Tax Assessment Tax Assessment Total Assessment is a certain percentage of the fair market value that is determined by local assessors to be the total taxable value of land and additions on the property. | Land | Improvement |
|---|---|---|---|---|
| 2025 | $3,594 | $417,023 | $90,000 | $327,023 |
| 2024 | $3,517 | $417,023 | $90,000 | $327,023 |
| 2023 | $3,219 | $319,261 | $62,000 | $257,261 |
| 2022 | $3,099 | $319,261 | $62,000 | $257,261 |
| 2021 | $3,037 | $319,261 | $62,000 | $257,261 |
| 2020 | $3,053 | $319,261 | $62,000 | $257,261 |
| 2019 | $2,893 | $268,317 | $48,000 | $220,317 |
| 2018 | $0 | $268,317 | $48,000 | $220,317 |
| 2017 | $0 | $268,317 | $48,000 | $220,317 |
| 2016 | $2,570 | $268,317 | $48,000 | $220,317 |
| 2015 | -- | $252,701 | $40,000 | $212,701 |
| 2014 | -- | $252,701 | $40,000 | $212,701 |
Source: Public Records
Map
Nearby Homes
- 5045 Homeplace Dr
- 804 Blue Thorn Dr
- 8401 Piney Branch Dr
- 8516 Newberry Grove Dr
- 3909 Langston Cir
- 3321 Langston Cir
- 104 Corapeake Way
- 333 Calvander Ln
- 3213 Alphawood Dr
- 8220 Bells Lake Rd
- 8224 Bells Lake Rd
- 8844 Forester Ln
- 7381 Capulin Crest Dr
- 8132 Wheeler Woods Dr
- 5340 Serene Forest Dr
- 3916 Grandbridge Dr
- 5728 Carriagehouse Ct
- 3101 Sawyers Mill Dr
- 8736 Manns Loop Rd
- 3813 W Lake Rd
- 223 Meadow Beauty Dr
- 225 Meadow Beauty Dr
- 225 Meadow Beauty Dr Unit 159
- 219 Meadow Beauty Dr
- 227 Meadow Beauty Dr
- 217 Meadow Beauty Dr
- 217 Meadow Beauty Dr Unit 162
- 229 Meadow Beauty Dr
- 215 Meadow Beauty Dr
- 224 Meadow Beauty Dr
- 220 Meadow Beauty Dr
- 231 Meadow Beauty Dr
- 231 Meadow Beauty Dr Unit 156
- 226 Meadow Beauty Dr
- 218 Meadow Beauty Dr
- 213 Meadow Beauty Dr
- 213 Meadow Beauty Dr Unit 164
- 228 Meadow Beauty Dr
- 216 Meadow Beauty Dr
- 5026 Homeplace Dr