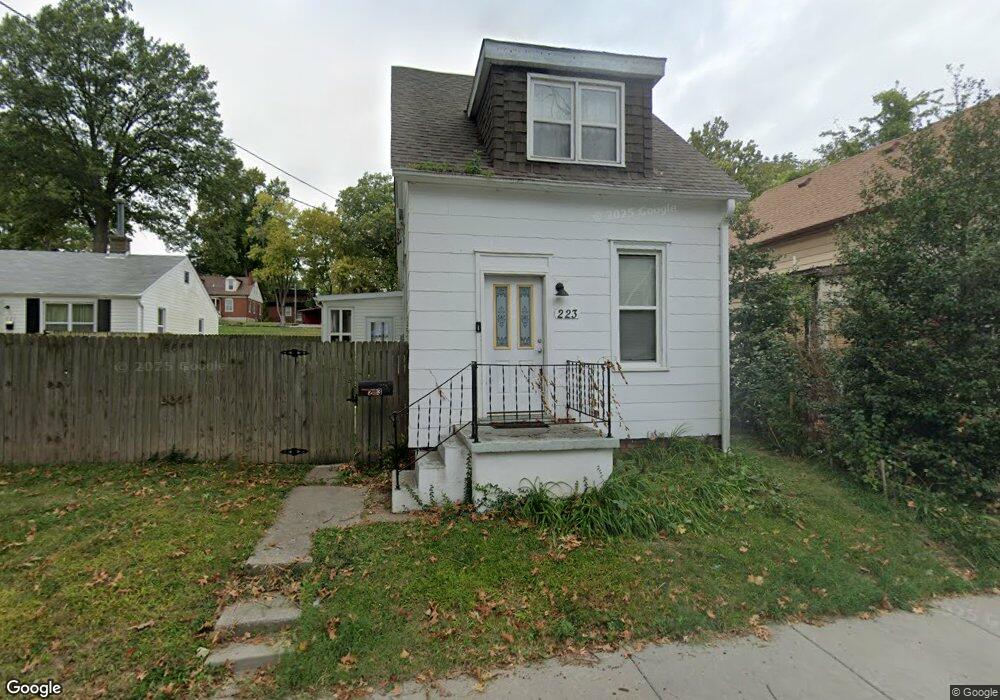
223 N 8th St Belleville, IL 62220
Estimated Value: $49,000 - $77,155
--
Bed
--
Bath
464
Sq Ft
$137/Sq Ft
Est. Value
About This Home
This home is located at 223 N 8th St, Belleville, IL 62220 and is currently estimated at $63,539, approximately $136 per square foot. 223 N 8th St is a home located in St. Clair County with nearby schools including Franklin Elementary School, Central Jr High School, and Governor French Academy.
Ownership History
Date
Name
Owned For
Owner Type
Purchase Details
Closed on
Nov 13, 2020
Sold by
Northway Jerry William and Northway Deborah Marie
Bought by
Buss Jason E
Current Estimated Value
Home Financials for this Owner
Home Financials are based on the most recent Mortgage that was taken out on this home.
Original Mortgage
$38,250
Outstanding Balance
$34,037
Interest Rate
2.8%
Mortgage Type
Commercial
Estimated Equity
$29,502
Purchase Details
Closed on
Jul 22, 2016
Sold by
Northway Jerry
Bought by
Northway Jerrry William and Northway Deborah Marie
Purchase Details
Closed on
Jun 20, 2016
Sold by
Gain Meta F
Bought by
Northway Jerry
Create a Home Valuation Report for This Property
The Home Valuation Report is an in-depth analysis detailing your home's value as well as a comparison with similar homes in the area
Home Values in the Area
Average Home Value in this Area
Purchase History
| Date | Buyer | Sale Price | Title Company |
|---|---|---|---|
| Buss Jason E | $45,000 | Accommodation | |
| Northway Jerrry William | -- | Attorney | |
| Northway Jerry | $11,000 | Fatic |
Source: Public Records
Mortgage History
| Date | Status | Borrower | Loan Amount |
|---|---|---|---|
| Open | Buss Jason E | $38,250 |
Source: Public Records
Tax History Compared to Growth
Tax History
| Year | Tax Paid | Tax Assessment Tax Assessment Total Assessment is a certain percentage of the fair market value that is determined by local assessors to be the total taxable value of land and additions on the property. | Land | Improvement |
|---|---|---|---|---|
| 2024 | $1,963 | $22,325 | $1,702 | $20,623 |
| 2023 | $1,813 | $19,314 | $1,668 | $17,646 |
| 2022 | $1,664 | $17,388 | $1,502 | $15,886 |
| 2021 | $1,603 | $16,075 | $1,389 | $14,686 |
| 2020 | $1,558 | $15,201 | $1,313 | $13,888 |
| 2019 | $376 | $3,629 | $1,314 | $2,315 |
| 2018 | $368 | $3,551 | $1,286 | $2,265 |
| 2017 | $369 | $3,526 | $1,277 | $2,249 |
| 2016 | $0 | $3,451 | $1,250 | $2,201 |
| 2014 | -- | $18,845 | $1,946 | $16,899 |
| 2013 | -- | $19,115 | $1,974 | $17,141 |
Source: Public Records
Map
Nearby Homes