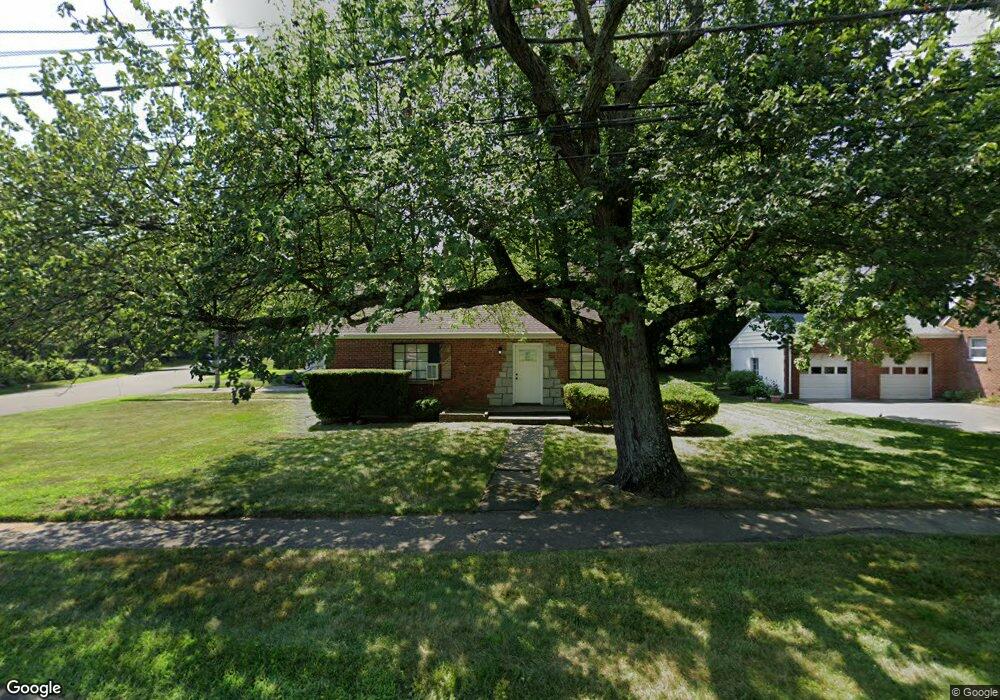
223 N Benson Rd Fairfield, CT 06824
Fairfield Center NeighborhoodEstimated Value: $563,000 - $880,000
4
Beds
3
Baths
1,702
Sq Ft
$432/Sq Ft
Est. Value
About This Home
This home is located at 223 N Benson Rd, Fairfield, CT 06824 and is currently estimated at $735,717, approximately $432 per square foot. 223 N Benson Rd is a home located in Fairfield County with nearby schools including Osborn Hill Elementary School, Fairfield Woods Middle School, and Fairfield Ludlowe High School.
Ownership History
Date
Name
Owned For
Owner Type
Purchase Details
Closed on
Jul 8, 1999
Sold by
Karageorge John
Bought by
Stawicki Anthony J and Stawicki Gina
Current Estimated Value
Home Financials for this Owner
Home Financials are based on the most recent Mortgage that was taken out on this home.
Original Mortgage
$177,400
Outstanding Balance
$48,240
Interest Rate
7.19%
Estimated Equity
$687,477
Purchase Details
Closed on
Aug 23, 1995
Sold by
Macdonnel Russel R and Pappas Susan F
Bought by
Karageorge John
Home Financials for this Owner
Home Financials are based on the most recent Mortgage that was taken out on this home.
Original Mortgage
$139,500
Interest Rate
7.32%
Mortgage Type
Unknown
Purchase Details
Closed on
Jul 31, 1987
Sold by
Foote Marion
Bought by
Macdonnell Russell R
Create a Home Valuation Report for This Property
The Home Valuation Report is an in-depth analysis detailing your home's value as well as a comparison with similar homes in the area
Home Values in the Area
Average Home Value in this Area
Purchase History
| Date | Buyer | Sale Price | Title Company |
|---|---|---|---|
| Stawicki Anthony J | $180,000 | -- | |
| Stawicki Anthony J | $180,000 | -- | |
| Karageorge John | $155,000 | -- | |
| Karageorge John | $155,000 | -- | |
| Macdonnell Russell R | $174,000 | -- |
Source: Public Records
Mortgage History
| Date | Status | Borrower | Loan Amount |
|---|---|---|---|
| Open | Macdonnell Russell R | $27,000 | |
| Open | Macdonnell Russell R | $177,400 | |
| Closed | Macdonnell Russell R | $177,400 | |
| Previous Owner | Macdonnell Russell R | $139,500 |
Source: Public Records
Tax History Compared to Growth
Tax History
| Year | Tax Paid | Tax Assessment Tax Assessment Total Assessment is a certain percentage of the fair market value that is determined by local assessors to be the total taxable value of land and additions on the property. | Land | Improvement |
|---|---|---|---|---|
| 2025 | $8,037 | $283,080 | $213,360 | $69,720 |
| 2024 | $7,898 | $283,080 | $213,360 | $69,720 |
| 2023 | $7,788 | $283,080 | $213,360 | $69,720 |
| 2022 | $7,711 | $283,080 | $213,360 | $69,720 |
| 2021 | $7,637 | $283,080 | $213,360 | $69,720 |
| 2020 | $7,657 | $285,810 | $211,120 | $74,690 |
| 2019 | $7,657 | $285,810 | $211,120 | $74,690 |
| 2018 | $7,534 | $285,810 | $211,120 | $74,690 |
| 2017 | $7,380 | $285,810 | $211,120 | $74,690 |
| 2016 | $7,274 | $285,810 | $211,120 | $74,690 |
| 2015 | $7,304 | $294,630 | $222,250 | $72,380 |
| 2014 | $7,189 | $294,630 | $222,250 | $72,380 |
Source: Public Records
Map
Nearby Homes
- 20 Ermine St
- 38 Edge Hill Rd
- 122 Colony St
- 2180 Kings Hwy Unit 1
- 117 Turney Rd
- 245 Unquowa Rd Unit 34
- 245 Unquowa Rd Unit 11
- 245 Unquowa Rd Unit 33
- 96 Clinton St
- 168 Wormwood Rd
- 15 Barton Rd
- 133 Green Acre Ln
- 361 Riverside Dr
- 378 Penfield Rd
- 394 Penfield Rd
- 345 Reef Rd Unit B6
- 345 Reef Rd Unit C9
- 294 Catherine Terrace
- 260 Birch Rd
- 137 Millard St