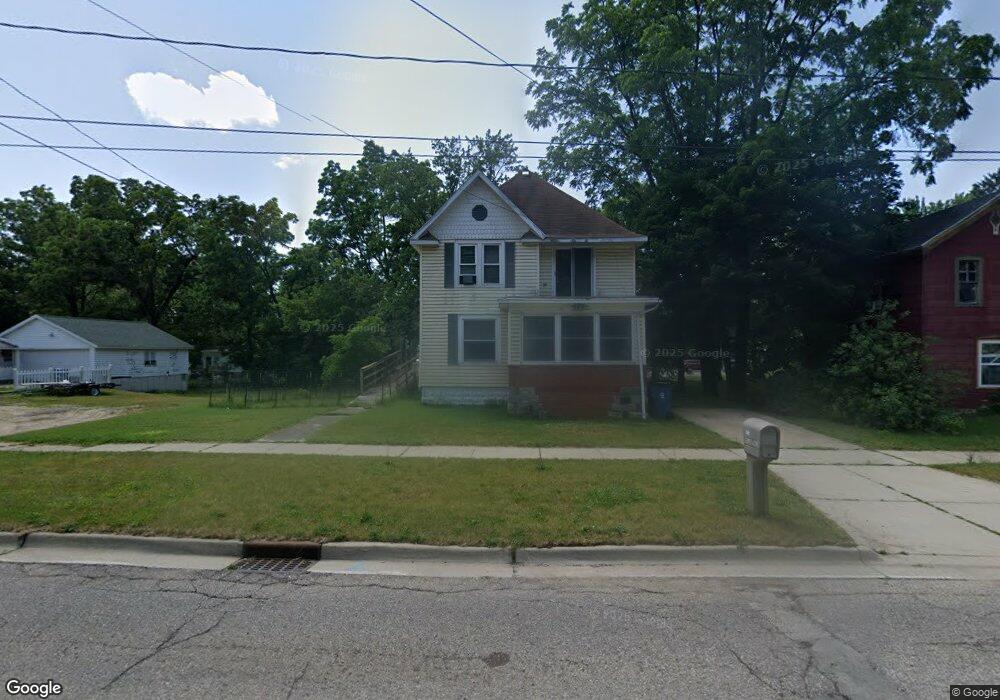
223 N Main St Allegan, MI 49010
Estimated Value: $198,000 - $215,000
3
Beds
3
Baths
1,700
Sq Ft
$120/Sq Ft
Est. Value
About This Home
This home is located at 223 N Main St, Allegan, MI 49010 and is currently estimated at $204,701, approximately $120 per square foot. 223 N Main St is a home located in Allegan County with nearby schools including North Ward Elementary School, L.E. White Middle School, and Allegan High School.
Ownership History
Date
Name
Owned For
Owner Type
Purchase Details
Closed on
May 1, 2006
Sold by
Doster Family Trust
Bought by
White Daniel L
Current Estimated Value
Home Financials for this Owner
Home Financials are based on the most recent Mortgage that was taken out on this home.
Original Mortgage
$70,000
Outstanding Balance
$40,471
Interest Rate
6.37%
Mortgage Type
Fannie Mae Freddie Mac
Estimated Equity
$164,230
Purchase Details
Closed on
Aug 8, 1998
Sold by
Doster Jerry and Doster Joyce
Bought by
Doster Family Trust
Purchase Details
Closed on
Aug 7, 1998
Bought by
Doster Family Trust Joyce
Create a Home Valuation Report for This Property
The Home Valuation Report is an in-depth analysis detailing your home's value as well as a comparison with similar homes in the area
Home Values in the Area
Average Home Value in this Area
Purchase History
| Date | Buyer | Sale Price | Title Company |
|---|---|---|---|
| White Daniel L | $70,000 | Chicago Title | |
| Doster Family Trust | -- | -- | |
| Doster Family Trust Joyce | -- | -- |
Source: Public Records
Mortgage History
| Date | Status | Borrower | Loan Amount |
|---|---|---|---|
| Open | White Daniel L | $70,000 |
Source: Public Records
Tax History Compared to Growth
Tax History
| Year | Tax Paid | Tax Assessment Tax Assessment Total Assessment is a certain percentage of the fair market value that is determined by local assessors to be the total taxable value of land and additions on the property. | Land | Improvement |
|---|---|---|---|---|
| 2025 | $1,626 | $87,100 | $16,500 | $70,600 |
| 2024 | $1,479 | $84,200 | $15,800 | $68,400 |
| 2023 | $1,533 | $72,100 | $14,900 | $57,200 |
| 2022 | $1,479 | $60,900 | $12,500 | $48,400 |
| 2021 | $1,414 | $56,600 | $9,900 | $46,700 |
| 2020 | $1,394 | $46,900 | $8,300 | $38,600 |
| 2019 | $1,360 | $41,600 | $7,300 | $34,300 |
| 2018 | $1,306 | $37,700 | $7,100 | $30,600 |
| 2017 | $0 | $34,900 | $5,900 | $29,000 |
| 2016 | $0 | $29,100 | $5,000 | $24,100 |
| 2015 | -- | $29,100 | $5,000 | $24,100 |
| 2014 | -- | $30,400 | $5,000 | $25,400 |
| 2013 | $1,932 | $31,700 | $5,000 | $26,700 |
Source: Public Records
Map
Nearby Homes