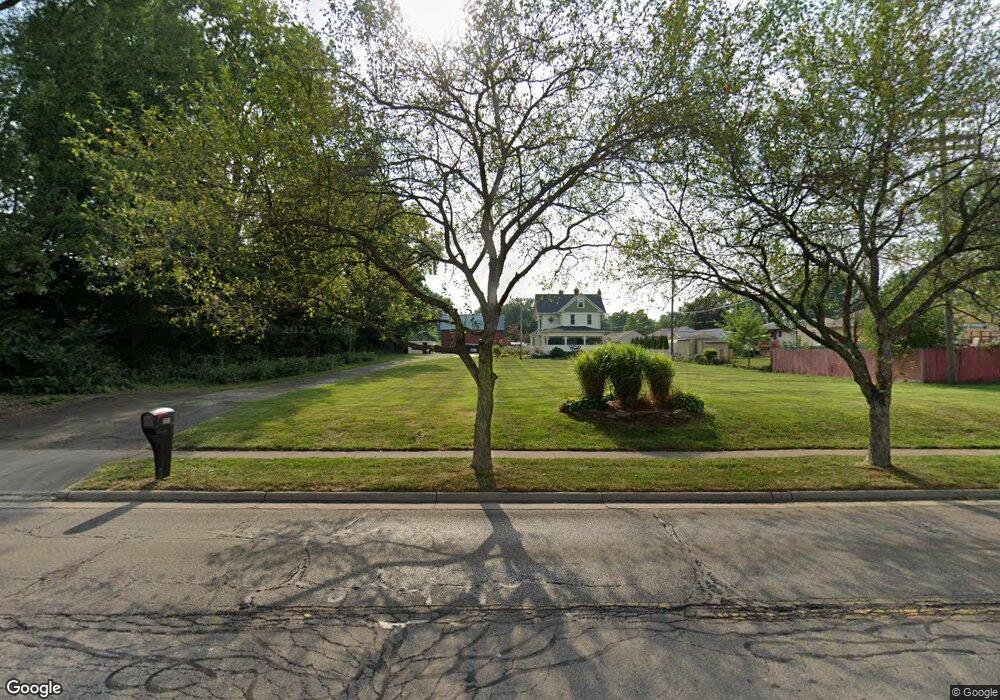
223 N Stygler Rd Columbus, OH 43230
Estimated Value: $337,000 - $446,000
4
Beds
2
Baths
2,600
Sq Ft
$149/Sq Ft
Est. Value
About This Home
This home is located at 223 N Stygler Rd, Columbus, OH 43230 and is currently estimated at $387,791, approximately $149 per square foot. 223 N Stygler Rd is a home located in Franklin County with nearby schools including Chapelfield Elementary School, Gahanna West Middle School, and Lincoln High School.
Ownership History
Date
Name
Owned For
Owner Type
Purchase Details
Closed on
Jul 29, 2002
Sold by
Kneeland Thomas R and Kneeland Rebecca L
Bought by
Bistrick Louise M
Current Estimated Value
Home Financials for this Owner
Home Financials are based on the most recent Mortgage that was taken out on this home.
Original Mortgage
$55,000
Outstanding Balance
$23,390
Interest Rate
6.62%
Mortgage Type
Purchase Money Mortgage
Estimated Equity
$364,401
Purchase Details
Closed on
Nov 20, 2001
Sold by
Kneeland Thomas R and Kneeland Rebecca L
Bought by
Bistrick Louise M
Home Financials for this Owner
Home Financials are based on the most recent Mortgage that was taken out on this home.
Original Mortgage
$100,000
Interest Rate
7.5%
Mortgage Type
Seller Take Back
Purchase Details
Closed on
Oct 2, 1978
Bought by
Kneeland Thomas R
Create a Home Valuation Report for This Property
The Home Valuation Report is an in-depth analysis detailing your home's value as well as a comparison with similar homes in the area
Home Values in the Area
Average Home Value in this Area
Purchase History
| Date | Buyer | Sale Price | Title Company |
|---|---|---|---|
| Bistrick Louise M | $200,000 | -- | |
| Bistrick Louise M | $200,000 | Lawyers Title | |
| Kneeland Thomas R | $44,000 | -- |
Source: Public Records
Mortgage History
| Date | Status | Borrower | Loan Amount |
|---|---|---|---|
| Open | Bistrick Louise M | $55,000 | |
| Previous Owner | Bistrick Louise M | $100,000 |
Source: Public Records
Tax History Compared to Growth
Tax History
| Year | Tax Paid | Tax Assessment Tax Assessment Total Assessment is a certain percentage of the fair market value that is determined by local assessors to be the total taxable value of land and additions on the property. | Land | Improvement |
|---|---|---|---|---|
| 2024 | $5,622 | $105,010 | $44,070 | $60,940 |
| 2023 | $6,462 | $120,015 | $44,065 | $75,950 |
| 2022 | $4,505 | $68,960 | $18,520 | $50,440 |
| 2021 | $4,641 | $72,880 | $18,520 | $54,360 |
| 2020 | $4,602 | $72,880 | $18,520 | $54,360 |
| 2019 | $3,938 | $63,500 | $15,440 | $48,060 |
| 2018 | $3,956 | $63,500 | $15,440 | $48,060 |
| 2017 | $3,615 | $63,500 | $15,440 | $48,060 |
| 2016 | $3,998 | $63,880 | $12,080 | $51,800 |
| 2015 | $4,002 | $63,880 | $12,080 | $51,800 |
| 2014 | $3,971 | $63,880 | $12,080 | $51,800 |
| 2013 | $1,972 | $63,875 | $12,075 | $51,800 |
Source: Public Records
Map
Nearby Homes
- 348 Imperial Dr
- 491 Daventry Ln
- 388 Elkwood Place
- 600 Agler Rd
- 221 Lincolnshire Rd
- 3888 Agler Rd
- 4125 Emerius Dr
- 300 Dunbarton Rd
- 300 Brookhaven Dr E
- 642 Ridenour Rd
- 206 Lintner St
- 536 Springwood Lake Dr
- 2694 Kantian Dr
- 0 E Minnesota Ave Unit 224018641
- 3784 Armuth Ave
- 407 Denison Ave
- 3832 Emmons Ave
- 0 E Emmons Ave
- 135 Serran Dr
- 3877 Hines Rd
- 387 Marquis Ct
- 381 Marquis Ct
- 393 Marquis Ct
- 235 N Stygler Rd
- 399 Marquis Ct
- 216 Imperial Dr
- 222 Imperial Dr
- 409 Marquis Ct
- 204 Imperial Dr
- 388 Marquis Ct
- 382 Marquis Ct
- 394 Marquis Ct
- 247 N Stygler Rd
- 216 N Stygler Rd
- 198 Imperial Dr
- 224 N Stygler Rd
- 400 Marquis Ct
- 208 N Stygler Rd
- 230 N Stygler Rd
- 200 N Stygler Rd