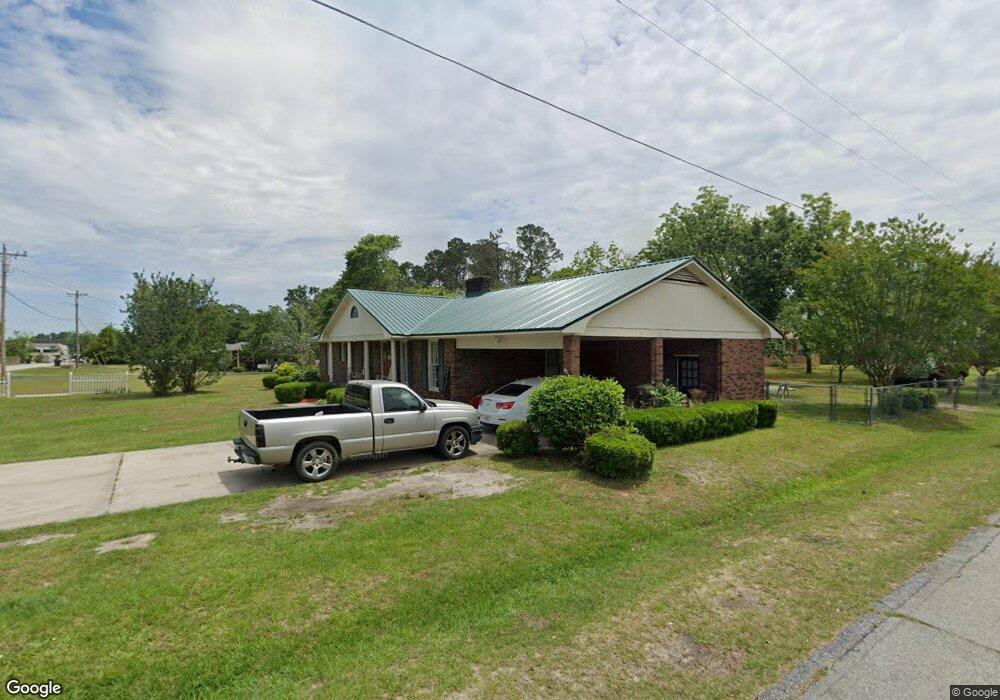
223 Neal St Unit S27 065 Swainsboro, GA 30401
Estimated Value: $178,629 - $209,000
3
Beds
2
Baths
1,850
Sq Ft
$107/Sq Ft
Est. Value
About This Home
This home is located at 223 Neal St Unit S27 065, Swainsboro, GA 30401 and is currently estimated at $197,657, approximately $106 per square foot. 223 Neal St Unit S27 065 is a home located in Emanuel County with nearby schools including Swainsboro Primary School, Swainsboro Elementary School, and Swainsboro Middle School.
Ownership History
Date
Name
Owned For
Owner Type
Purchase Details
Closed on
May 3, 2018
Sold by
Gordon Gennie Mae
Bought by
Gordon Tara J
Current Estimated Value
Purchase Details
Closed on
Dec 16, 2016
Sold by
Betty
Bought by
Blair Gennie Mae Gordon
Home Financials for this Owner
Home Financials are based on the most recent Mortgage that was taken out on this home.
Original Mortgage
$90,530
Interest Rate
3.94%
Mortgage Type
New Conventional
Create a Home Valuation Report for This Property
The Home Valuation Report is an in-depth analysis detailing your home's value as well as a comparison with similar homes in the area
Home Values in the Area
Average Home Value in this Area
Purchase History
| Date | Buyer | Sale Price | Title Company |
|---|---|---|---|
| Gordon Tara J | -- | -- | |
| Blair Gennie Mae Gordon | $110,000 | -- |
Source: Public Records
Mortgage History
| Date | Status | Borrower | Loan Amount |
|---|---|---|---|
| Previous Owner | Blair Gennie Mae Gordon | $90,530 |
Source: Public Records
Tax History Compared to Growth
Tax History
| Year | Tax Paid | Tax Assessment Tax Assessment Total Assessment is a certain percentage of the fair market value that is determined by local assessors to be the total taxable value of land and additions on the property. | Land | Improvement |
|---|---|---|---|---|
| 2024 | $2,282 | $58,152 | $1,035 | $57,117 |
| 2023 | $1,351 | $49,591 | $1,035 | $48,556 |
| 2022 | $1,130 | $45,529 | $1,035 | $44,494 |
| 2021 | $1,038 | $40,992 | $900 | $40,092 |
| 2020 | $1,192 | $44,614 | $2,000 | $42,614 |
| 2019 | $1,185 | $44,326 | $2,000 | $42,326 |
| 2018 | $1,178 | $44,564 | $2,000 | $42,564 |
| 2017 | $1,182 | $44,564 | $2,000 | $42,564 |
| 2016 | $921 | $36,721 | $2,000 | $34,721 |
| 2015 | -- | $36,697 | $1,976 | $34,721 |
| 2014 | -- | $36,185 | $1,976 | $34,209 |
| 2013 | -- | $35,903 | $1,976 | $33,927 |
Source: Public Records
Map
Nearby Homes
- 240 Lakewood Dr
- 118 Pierce Ave
- 455 Moreland Ave
- 119 Horseshoe Loop
- 331 S Green St
- 542 Jones Ave
- 209 Price St
- 0 Mcleod Dr
- 120 Essex Rd
- 555 Mulberry St
- 555 Jordan Ln
- 0 Rd Unit 10512197
- 316 W Moring St
- 532 Calhoun St
- 547 W Moring St
- 727 Old Nunez Rd
- 327 W Church St
- 217 Mimosa Dr
- 219 Lucky St
- 167 Fortune Loop