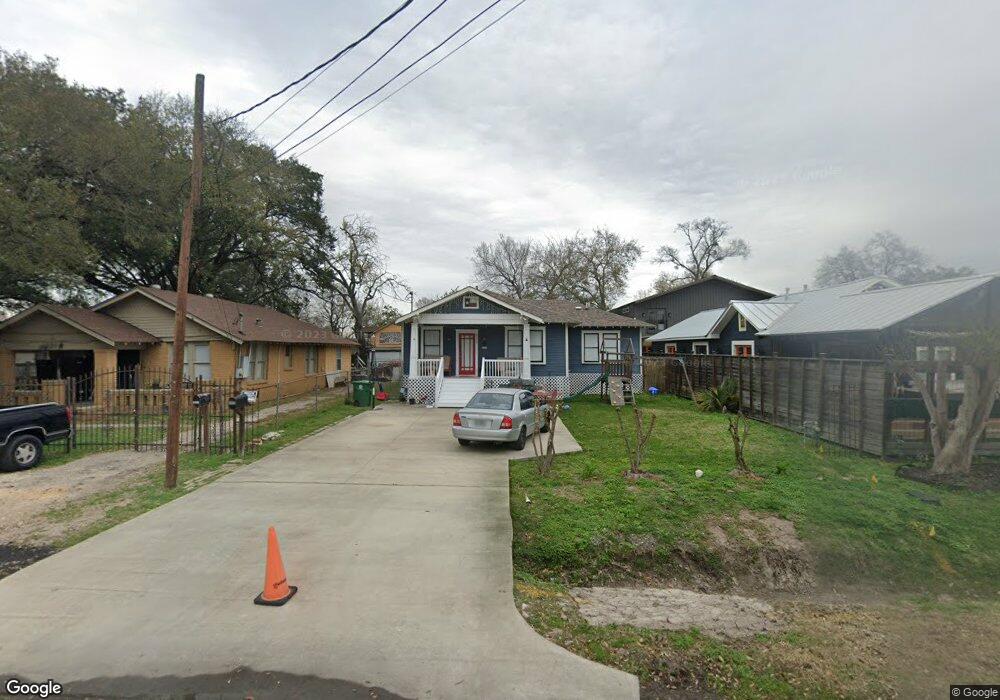
223 Neyland St Houston, TX 77022
Northside-Northline NeighborhoodEstimated Value: $291,123 - $339,000
3
Beds
2
Baths
1,740
Sq Ft
$183/Sq Ft
Est. Value
About This Home
This home is located at 223 Neyland St, Houston, TX 77022 and is currently estimated at $318,031, approximately $182 per square foot. 223 Neyland St is a home with nearby schools including Herrera Elementary School, Burbank Middle School, and Sam Houston Math, Science & Technology Center.
Ownership History
Date
Name
Owned For
Owner Type
Purchase Details
Closed on
May 11, 2015
Sold by
Rodriguez Edward J
Bought by
Rodriguze Jorge J and Rosaria Rodriguze Maria Del
Current Estimated Value
Purchase Details
Closed on
Feb 29, 2008
Sold by
Rodriguez Jorge J and Rodriguez Maria Del Rosario
Bought by
Rodriguez Edward J
Purchase Details
Closed on
Aug 11, 2003
Sold by
Devco Land Development Ltd
Bought by
Perry Homes
Create a Home Valuation Report for This Property
The Home Valuation Report is an in-depth analysis detailing your home's value as well as a comparison with similar homes in the area
Home Values in the Area
Average Home Value in this Area
Purchase History
| Date | Buyer | Sale Price | Title Company |
|---|---|---|---|
| Rodriguze Jorge J | -- | None Available | |
| Rodriguez Edward J | -- | None Available | |
| Perry Homes | -- | Chicago Title |
Source: Public Records
Tax History Compared to Growth
Tax History
| Year | Tax Paid | Tax Assessment Tax Assessment Total Assessment is a certain percentage of the fair market value that is determined by local assessors to be the total taxable value of land and additions on the property. | Land | Improvement |
|---|---|---|---|---|
| 2025 | $963 | $270,000 | $103,275 | $166,725 |
| 2024 | $963 | $294,299 | $103,275 | $191,024 |
| 2023 | $938 | $307,709 | $89,606 | $218,103 |
| 2022 | $5,351 | $243,000 | $66,825 | $176,175 |
| 2021 | $5,585 | $239,647 | $66,825 | $172,822 |
| 2020 | $5,259 | $217,179 | $66,825 | $150,354 |
| 2019 | $4,808 | $205,029 | $54,675 | $150,354 |
| 2018 | $3,669 | $145,000 | $37,969 | $107,031 |
| 2017 | $3,666 | $145,000 | $37,969 | $107,031 |
| 2016 | $3,666 | $145,000 | $37,969 | $107,031 |
| 2015 | $547 | $30,375 | $30,375 | $0 |
| 2014 | $547 | $21,263 | $21,263 | $0 |
Source: Public Records
Map
Nearby Homes
- 7111 Bauman Rd
- 249 Basswood St
- 7014 Finn St
- 7311 Roswell St
- 164 Wallace St
- 7317 Roswell St
- 7018 Finn St
- 210 Van Molan St
- 7015 Roswell St
- 7315 Roswell St
- 105 Oddo St
- 7009 Amber St
- 121-123 Van Molan St
- 65 Neyland St
- 311 & 309 Bennington St
- 245 Palmyra St
- 428 Van Molan St
- 7523 Roswell St
- 136 Theron St
- 212B Garrotsville St
- 221 Neyland St
- 227 Neyland St
- 219 Neyland St
- 229 Neyland St
- 229 Neyland St Unit A
- 229 Neyland St Unit B
- 229 Neyland St Unit C
- 224 Weisenberger Dr
- 226 Weisenberger Dr
- 222 Weisenberger Dr
- 228 Weisenberger Dr
- 224 Neyland St
- 224 Neyland St
- 220 Weisenberger Dr
- 231 Neyland St
- 226 Neyland St
- 232 Weisenberger Dr Unit 1
- 232 Weisenberger Dr
- 222 Neyland St
- 228 Neyland St