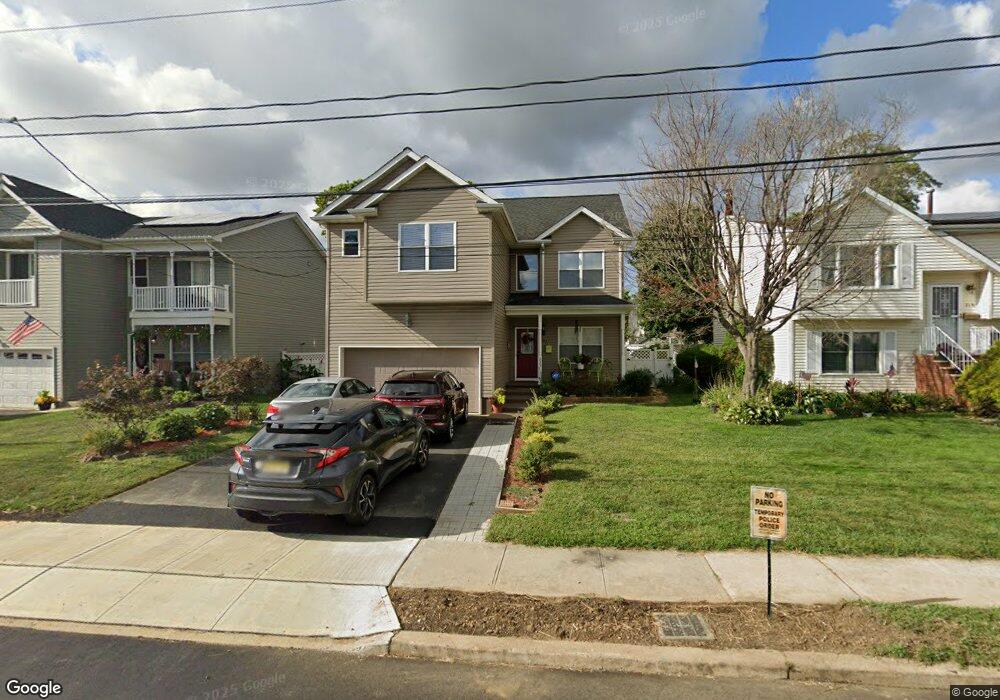
223 Orchard St Keyport, NJ 07735
Estimated Value: $631,162 - $723,000
4
Beds
3
Baths
2,144
Sq Ft
$319/Sq Ft
Est. Value
About This Home
This home is located at 223 Orchard St, Keyport, NJ 07735 and is currently estimated at $683,291, approximately $318 per square foot. 223 Orchard St is a home located in Monmouth County with nearby schools including Matawan Reg High School, Icob Academy, and St. Joseph Elementary School.
Ownership History
Date
Name
Owned For
Owner Type
Purchase Details
Closed on
Mar 20, 2009
Sold by
Parkside Manor Inc
Bought by
Sumagaysay Florence G
Current Estimated Value
Home Financials for this Owner
Home Financials are based on the most recent Mortgage that was taken out on this home.
Original Mortgage
$363,750
Outstanding Balance
$232,763
Interest Rate
5.25%
Mortgage Type
Stand Alone First
Estimated Equity
$450,528
Purchase Details
Closed on
Jun 23, 2008
Sold by
Kasson Reo Llc
Bought by
Parkside Manor Inc
Create a Home Valuation Report for This Property
The Home Valuation Report is an in-depth analysis detailing your home's value as well as a comparison with similar homes in the area
Home Values in the Area
Average Home Value in this Area
Purchase History
| Date | Buyer | Sale Price | Title Company |
|---|---|---|---|
| Sumagaysay Florence G | $382,900 | None Available | |
| Parkside Manor Inc | $120,500 | Trident Abstract Title Agenc |
Source: Public Records
Mortgage History
| Date | Status | Borrower | Loan Amount |
|---|---|---|---|
| Open | Sumagaysay Florence G | $363,750 |
Source: Public Records
Tax History Compared to Growth
Tax History
| Year | Tax Paid | Tax Assessment Tax Assessment Total Assessment is a certain percentage of the fair market value that is determined by local assessors to be the total taxable value of land and additions on the property. | Land | Improvement |
|---|---|---|---|---|
| 2025 | $10,459 | $558,600 | $268,800 | $289,800 |
| 2024 | $10,060 | $510,200 | $222,400 | $287,800 |
| 2023 | $10,060 | $464,000 | $179,600 | $284,400 |
| 2022 | $10,662 | $430,800 | $156,900 | $273,900 |
| 2021 | $10,662 | $390,700 | $144,300 | $246,400 |
| 2020 | $10,410 | $380,200 | $136,700 | $243,500 |
| 2019 | $10,388 | $368,500 | $123,700 | $244,800 |
| 2018 | $9,567 | $339,600 | $116,300 | $223,300 |
| 2017 | $9,472 | $341,100 | $122,300 | $218,800 |
| 2016 | $8,729 | $327,900 | $112,300 | $215,600 |
| 2015 | $9,038 | $325,700 | $102,300 | $223,400 |
| 2014 | $8,977 | $329,300 | $107,300 | $222,000 |
Source: Public Records
Map
Nearby Homes
- 345 Shadynook St
- 358 Shadynook St
- 745 Cliffwood Ave
- 811 Shore Concourse
- 839 Brookside Ave
- 871 S Concourse
- 108 W Concourse
- 910 Malden Dr
- 205 Meinzer St
- 369 Riverdale Dr
- 308 Myrtle St
- 998 Woodmere Dr
- 325 Meinzer St
- 136 Hilltop Blvd
- 57 Pacific Blvd
- 300 Beachwood Way
- 76 Woodland Dr
- 227 W Prospect Ave
- 112 Lcpl Phillip E Frank Way
- 215 Edgeview Rd