Estimated Value: $63,530 - $94,000
3
Beds
1
Bath
788
Sq Ft
$98/Sq Ft
Est. Value
About This Home
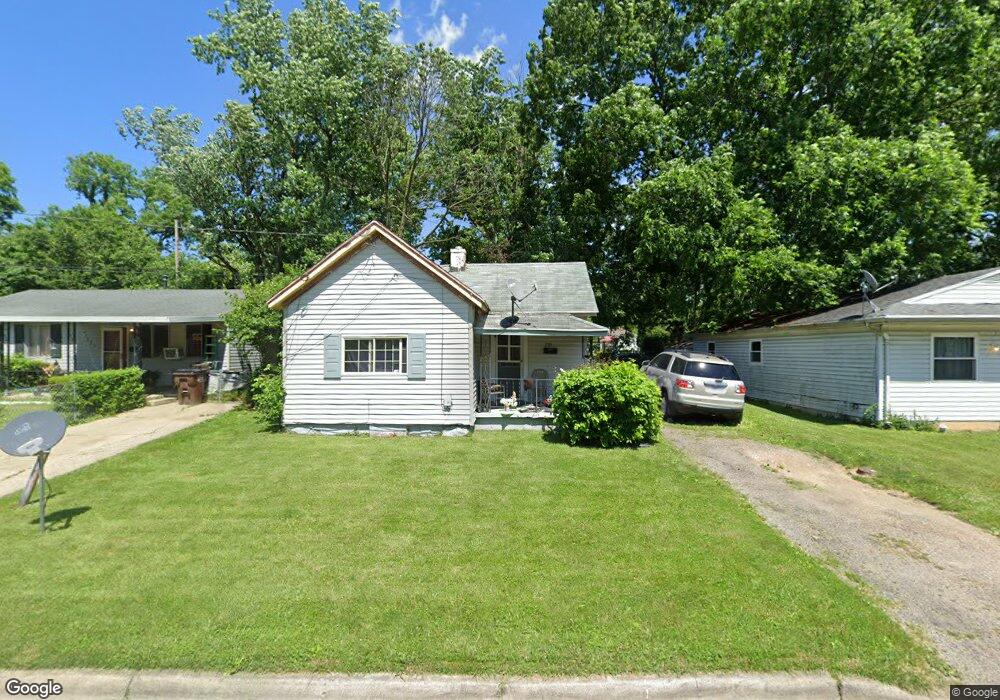
This home is located at 223 Orchard St, Xenia, OH 45385 and is currently estimated at $77,177, approximately $97 per square foot. 223 Orchard St is a home located in Greene County with nearby schools including Xenia High School, Summit Academy Community School for Alternative Learners - Xenia, and Legacy Christian Academy.
Ownership History
Date
Name
Owned For
Owner Type
Purchase Details
Closed on
Nov 22, 2022
Sold by
Tudor Lisa
Bought by
Wright Choice Rentals Llc
Current Estimated Value
Purchase Details
Closed on
Jun 3, 2011
Sold by
Coleman Ryan D and Coleman Lauren
Bought by
Tudor Lisa
Purchase Details
Closed on
Mar 17, 2010
Sold by
Turney Robin D
Bought by
Coleman Ryan D and Coleman Laureen
Purchase Details
Closed on
Dec 9, 2003
Sold by
Hensley Cyrus C
Bought by
Kelly James
Purchase Details
Closed on
Oct 31, 2003
Sold by
Estate Of Hercules H Hensley
Bought by
Hensley Cyrus C
Create a Home Valuation Report for This Property
The Home Valuation Report is an in-depth analysis detailing your home's value as well as a comparison with similar homes in the area
Home Values in the Area
Average Home Value in this Area
Purchase History
| Date | Buyer | Sale Price | Title Company |
|---|---|---|---|
| Wright Choice Rentals Llc | $40,000 | None Listed On Document | |
| Tudor Lisa | $15,000 | Attorney | |
| Coleman Ryan D | $5,000 | None Available | |
| Kelly James | $20,000 | -- | |
| Hensley Cyrus C | -- | -- |
Source: Public Records
Tax History Compared to Growth
Tax History
| Year | Tax Paid | Tax Assessment Tax Assessment Total Assessment is a certain percentage of the fair market value that is determined by local assessors to be the total taxable value of land and additions on the property. | Land | Improvement |
|---|---|---|---|---|
| 2024 | $629 | $14,710 | $1,390 | $13,320 |
| 2023 | $629 | $14,710 | $1,390 | $13,320 |
| 2022 | $294 | $5,870 | $1,260 | $4,610 |
| 2021 | $298 | $5,870 | $1,260 | $4,610 |
| 2020 | $286 | $5,870 | $1,260 | $4,610 |
| 2019 | $286 | $5,530 | $1,640 | $3,890 |
| 2018 | $287 | $5,530 | $1,640 | $3,890 |
| 2017 | $348 | $5,530 | $1,640 | $3,890 |
| 2016 | $418 | $5,350 | $1,640 | $3,710 |
| 2015 | $601 | $5,350 | $1,640 | $3,710 |
| 2014 | $422 | $5,350 | $1,640 | $3,710 |
Source: Public Records
Map
Nearby Homes