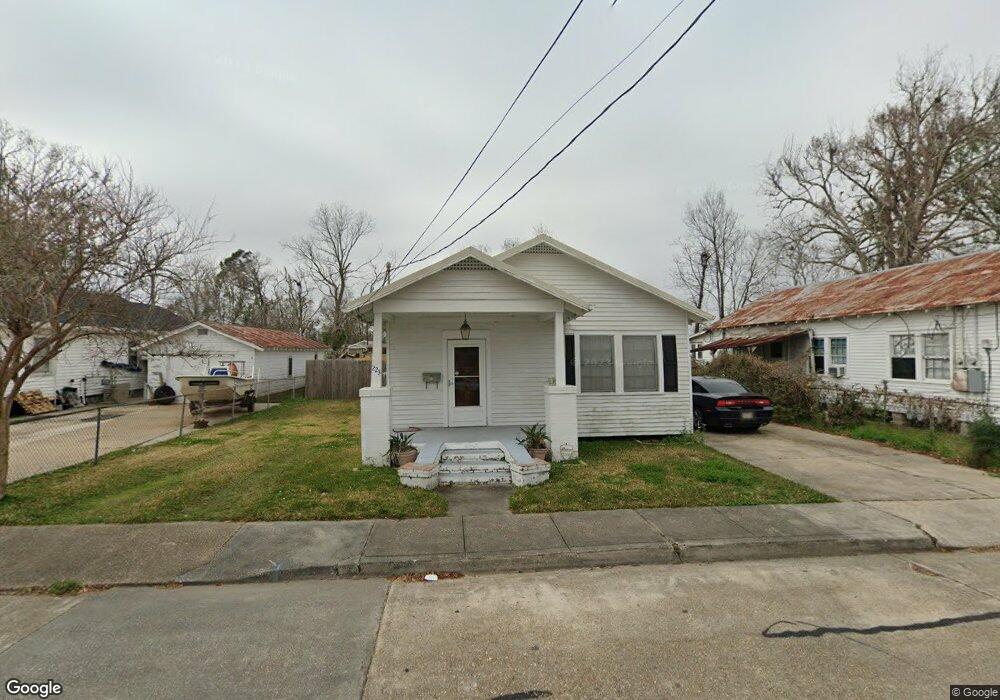
223 Palm Ave Houma, LA 70364
North Houma NeighborhoodEstimated Value: $101,171 - $123,000
2
Beds
1
Bath
1,174
Sq Ft
$94/Sq Ft
Est. Value
About This Home
This home is located at 223 Palm Ave, Houma, LA 70364 and is currently estimated at $110,543, approximately $94 per square foot. 223 Palm Ave is a home located in Terrebonne Parish with nearby schools including Legion Park Elementary, Houma Junior High School, and Terrebonne High School.
Ownership History
Date
Name
Owned For
Owner Type
Purchase Details
Closed on
Feb 4, 2022
Sold by
Michael Rhodes Aaron and Michael Brianna
Bought by
Boudwin Jordan
Current Estimated Value
Home Financials for this Owner
Home Financials are based on the most recent Mortgage that was taken out on this home.
Original Mortgage
$94,500
Outstanding Balance
$87,644
Interest Rate
3.45%
Mortgage Type
New Conventional
Estimated Equity
$22,899
Purchase Details
Closed on
Aug 9, 2018
Sold by
Lynn-Boudreaux Kaysie
Bought by
Rhodes Aaron M
Create a Home Valuation Report for This Property
The Home Valuation Report is an in-depth analysis detailing your home's value as well as a comparison with similar homes in the area
Home Values in the Area
Average Home Value in this Area
Purchase History
| Date | Buyer | Sale Price | Title Company |
|---|---|---|---|
| Boudwin Jordan | -- | Prentice Derrick D | |
| Rhodes Aaron M | $91,000 | -- |
Source: Public Records
Mortgage History
| Date | Status | Borrower | Loan Amount |
|---|---|---|---|
| Open | Boudwin Jordan | $94,500 |
Source: Public Records
Tax History Compared to Growth
Tax History
| Year | Tax Paid | Tax Assessment Tax Assessment Total Assessment is a certain percentage of the fair market value that is determined by local assessors to be the total taxable value of land and additions on the property. | Land | Improvement |
|---|---|---|---|---|
| 2024 | $225 | $8,600 | $1,290 | $7,310 |
| 2023 | $225 | $8,190 | $1,230 | $6,960 |
| 2022 | $185 | $8,190 | $1,230 | $6,960 |
| 2021 | $123 | $7,490 | $1,230 | $6,260 |
| 2020 | $696 | $8,190 | $1,230 | $6,960 |
| 2019 | $519 | $5,630 | $1,230 | $4,400 |
| 2018 | $89 | $5,360 | $1,170 | $4,190 |
| 2017 | $501 | $5,360 | $1,170 | $4,190 |
| 2015 | -- | $5,110 | $1,115 | $3,995 |
| 2014 | $85 | $5,110 | $0 | $0 |
| 2013 | $85 | $5,110 | $0 | $0 |
Source: Public Records
Map
Nearby Homes