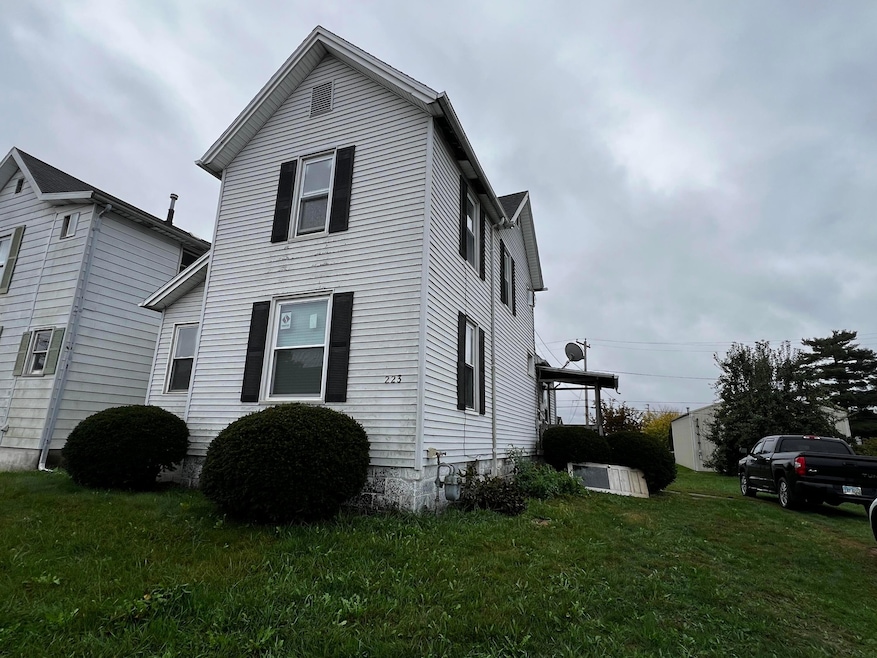
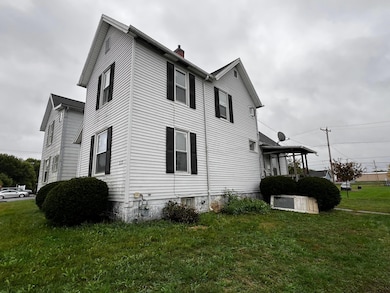
223 Pine St Coshocton, OH 43812
Estimated payment $678/month
About This Home
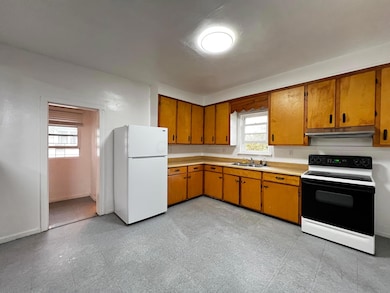
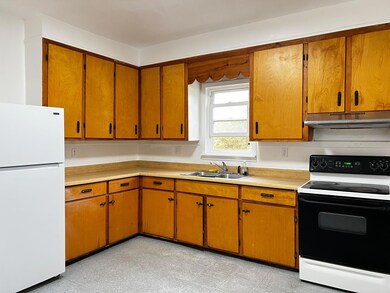
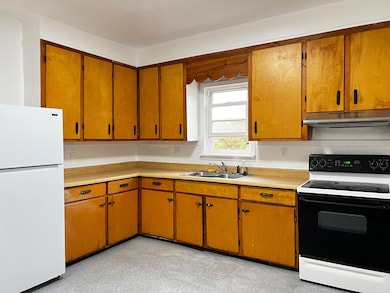
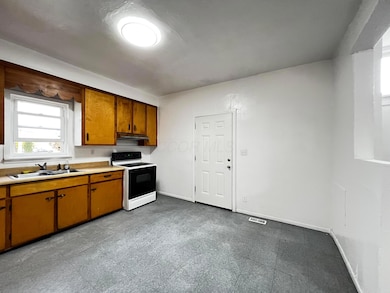
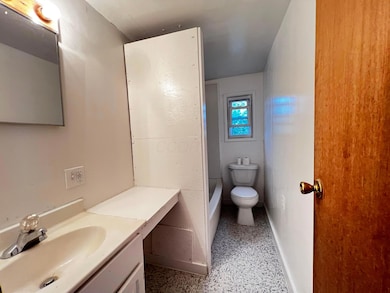
223 Pine St offers a practical opportunity for a first-time buyer, fixer-upper enthusiast, or investor seeking a property with potential in Coshocton. This 3-bedroom, 2-bath home provides approximately 1,190 square feet of functional living space and a straightforward layout. The main level features a living room connected to the dining area and kitchen, creating a simple flow suited for everyday living. Upstairs, three bedrooms offer flexible use for sleeping, guests, or a home office. The unfinished basement provides additional storage and utility space. Located in an established neighborhood near schools, parks, downtown Coshocton, and a short drive to Roscoe Village, this property is ideal for buyers looking to renovate, add value, or build long-term equity. Whether you're planning personal updates or exploring rental potential, this home presents a solid starting point in the 43812 area.
Home Details
Home Type
- Single Family
Est. Annual Taxes
- $772
Year Built
- Built in 1910
Parking
- No Garage
Home Design
- Block Foundation
- Vinyl Siding
Interior Spaces
- 1,190 Sq Ft Home
- 2-Story Property
- Basement Fills Entire Space Under The House
- Laundry on lower level
Flooring
- Carpet
- Laminate
- Vinyl
Bedrooms and Bathrooms
Additional Features
- 2,178 Sq Ft Lot
- Heating System Uses Gas
Community Details
- No Home Owners Association
Listing and Financial Details
- Assessor Parcel Number 04300-001-860-00
Map
Home Values in the Area
Average Home Value in this Area
Tax History
| Year | Tax Paid | Tax Assessment Tax Assessment Total Assessment is a certain percentage of the fair market value that is determined by local assessors to be the total taxable value of land and additions on the property. | Land | Improvement |
|---|---|---|---|---|
| 2024 | $772 | $18,240 | $3,060 | $15,180 |
| 2023 | $772 | $14,354 | $2,356 | $11,998 |
| 2022 | $704 | $14,354 | $2,356 | $11,998 |
| 2021 | $705 | $14,354 | $2,356 | $11,998 |
| 2020 | $772 | $15,247 | $2,524 | $12,723 |
| 2019 | $781 | $15,247 | $2,524 | $12,723 |
| 2018 | $758 | $15,247 | $2,524 | $12,723 |
| 2017 | $795 | $15,079 | $2,356 | $12,723 |
| 2016 | $764 | $15,079 | $2,356 | $12,723 |
| 2015 | $682 | $15,079 | $2,356 | $12,723 |
| 2014 | $682 | $14,365 | $2,356 | $12,009 |
Property History
| Date | Event | Price | List to Sale | Price per Sq Ft |
|---|---|---|---|---|
| 01/13/2026 01/13/26 | Price Changed | $115,000 | -3.4% | $97 / Sq Ft |
| 12/06/2025 12/06/25 | Price Changed | $119,000 | -4.0% | $100 / Sq Ft |
| 10/20/2025 10/20/25 | For Sale | $124,000 | -- | $104 / Sq Ft |
Purchase History
| Date | Type | Sale Price | Title Company |
|---|---|---|---|
| Warranty Deed | $75,000 | None Available | |
| Contract Of Sale | $75,000 | None Available | |
| Quit Claim Deed | -- | None Available | |
| Deed | $65,000 | -- | |
| Deed | -- | -- | |
| Deed | -- | -- | |
| Deed | -- | -- |
Mortgage History
| Date | Status | Loan Amount | Loan Type |
|---|---|---|---|
| Previous Owner | $25,000 | Seller Take Back |
Source: Columbus and Central Ohio Regional MLS
MLS Number: 225038275
APN: 04300-001-860-00
Disclaimer: Certain information contained herein is derived from information provided by parties other than Homes.com. All information provided is deemed reliable, but is not guaranteed to be accurate and should be independently verified.
![]() IDX information is provided exclusively for personal, non-commercial use, and may not be used for any purpose other than to identify prospective properties consumers may be interested in purchasing.
IDX information is provided exclusively for personal, non-commercial use, and may not be used for any purpose other than to identify prospective properties consumers may be interested in purchasing.
Information is deemed reliable but not guaranteed.
- 364 S 10th St
- 9090 Radcliffe Rd
- 63 Jody Dr Unit 9
- 123 E Church St
- 79 W 2nd St
- 4251 Strattford Cir W
- 1328 Richey Rd Unit A
- 1259 Muirwood Dr
- 1060 Brandywine Blvd Unit D
- 1060 Brandywine Blvd Unit H
- 1135 Brandywine Blvd Unit D
- 909 Garden Rd
- 1356 Athena Ln
- 3356 Meadowood Dr
- 1512 Venus Place
- 3139 Sandhurst Dr
- 740 Princeton Ave Unit 1
- 2309 Wilmer St
- 1535 Central Ave
- 1604 Maple Ave

Ask me questions while you tour the home.