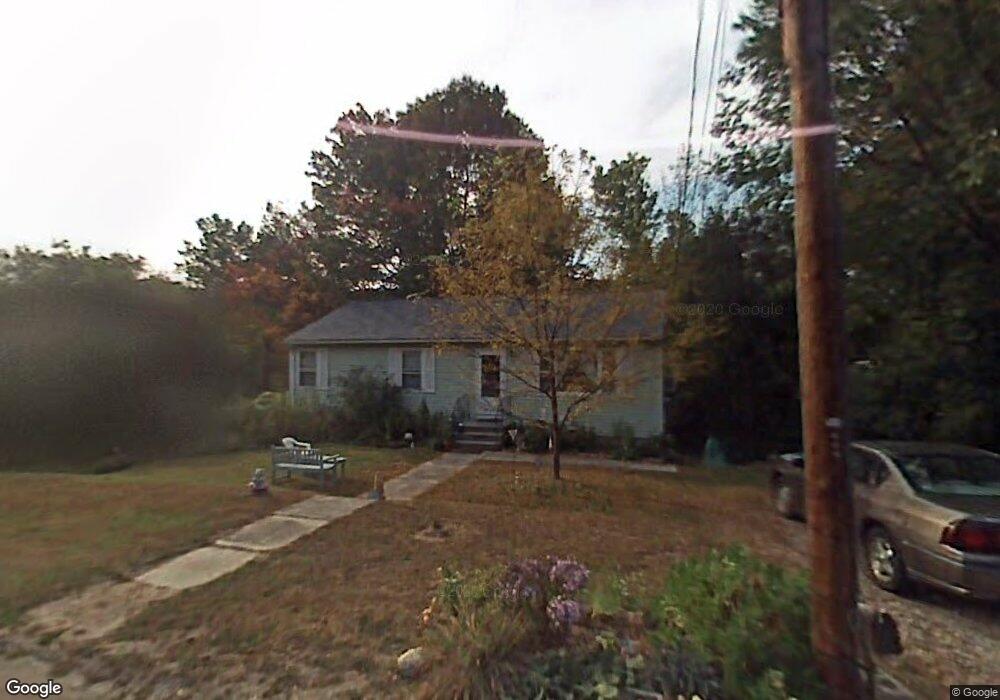
223 Railroad St Thomaston, CT 06787
Estimated Value: $248,000 - $306,000
3
Beds
2
Baths
1,092
Sq Ft
$247/Sq Ft
Est. Value
About This Home
This home is located at 223 Railroad St, Thomaston, CT 06787 and is currently estimated at $269,437, approximately $246 per square foot. 223 Railroad St is a home located in Litchfield County with nearby schools including Black Rock School, Thomaston Center School, and Thomaston High School.
Create a Home Valuation Report for This Property
The Home Valuation Report is an in-depth analysis detailing your home's value as well as a comparison with similar homes in the area
Home Values in the Area
Average Home Value in this Area
Tax History Compared to Growth
Tax History
| Year | Tax Paid | Tax Assessment Tax Assessment Total Assessment is a certain percentage of the fair market value that is determined by local assessors to be the total taxable value of land and additions on the property. | Land | Improvement |
|---|---|---|---|---|
| 2025 | $4,337 | $121,100 | $46,340 | $74,760 |
| 2024 | $4,161 | $121,100 | $46,340 | $74,760 |
| 2023 | $4,073 | $121,100 | $46,340 | $74,760 |
| 2022 | $3,889 | $121,100 | $46,340 | $74,760 |
| 2021 | $4,138 | $114,520 | $46,340 | $68,180 |
| 2020 | $4,138 | $114,520 | $46,340 | $68,180 |
| 2019 | $4,183 | $114,520 | $46,340 | $68,180 |
| 2018 | $4,099 | $114,520 | $46,340 | $68,180 |
| 2017 | $4,014 | $114,520 | $46,340 | $68,180 |
| 2016 | $3,825 | $112,280 | $44,100 | $68,180 |
| 2015 | $3,776 | $112,280 | $44,100 | $68,180 |
| 2014 | $3,776 | $112,280 | $44,100 | $68,180 |
Source: Public Records
Map
Nearby Homes
- 71 Treadwell Ave
- 461 E Main St
- 104 Judson St
- 16 Tracy St
- 785 Main St
- 17 George St
- 120 Hotchkiss Ave
- 22 Park St
- 684 Main St
- 362 Hill Rd
- 7 South St
- 96 Elm St
- 56 Hillside Ave
- 49 Center St
- 211 Pine Hill Blvd Unit 211
- 214 Pine Hill Blvd Unit 214
- 42 Litchfield St
- 21 Schroback Rd
- 174 Litchfield St
- 26 Julia Ln
- 214 Railroad St
- 21 Railroad Street Annex
- 273 Railroad St
- 242 Railroad St
- 260 Railroad St
- 31 Railroad Street Annex
- 227 Railroad St
- 227 Railroad St Unit 1
- 227 Railroad St Unit 2
- 10 Railroad Street Annex
- 20 Railroad Street Annex
- 218 Bristol St
- 276 Railroad St
- 270A Railroad St
- 270 Railroad St
- 299 Railroad St
- 30 Railroad Street Annex
- 290 Railroad St
- 198 Bristol St
- 60 Railroad Street Annex