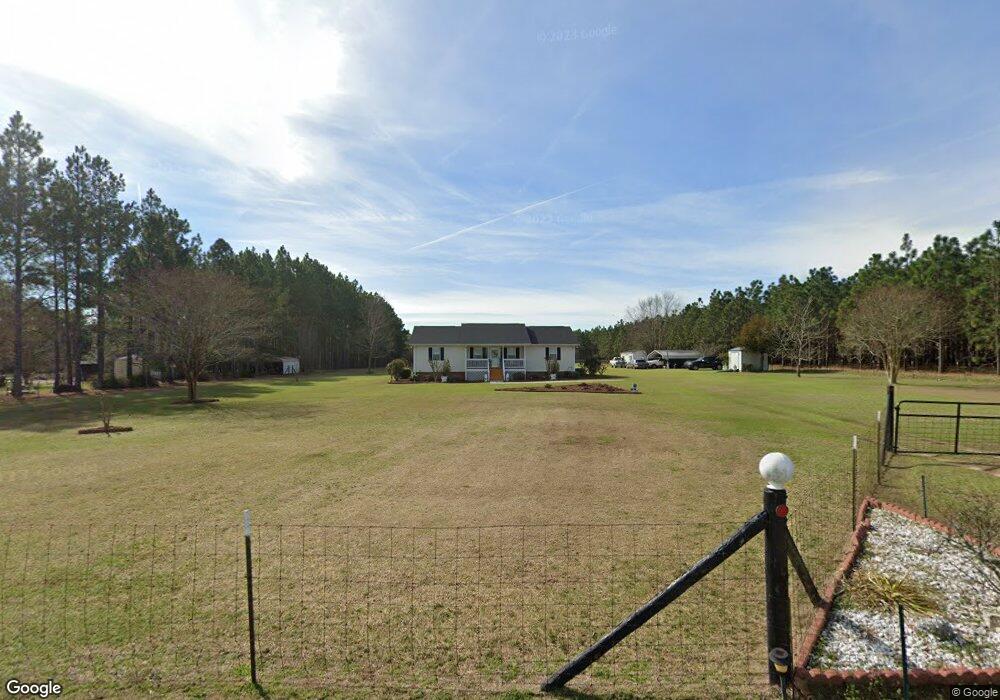
223 Smith Ln Ashburn, GA 31714
Estimated Value: $156,918 - $270,000
3
Beds
2
Baths
1,400
Sq Ft
$167/Sq Ft
Est. Value
About This Home
This home is located at 223 Smith Ln, Ashburn, GA 31714 and is currently estimated at $233,230, approximately $166 per square foot. 223 Smith Ln is a home located in Turner County with nearby schools including Turner County Elementary School, Turner County Middle School, and Turner County High School.
Ownership History
Date
Name
Owned For
Owner Type
Purchase Details
Closed on
Jan 29, 2008
Sold by
Paulk David A
Bought by
Fulks Doris M
Current Estimated Value
Home Financials for this Owner
Home Financials are based on the most recent Mortgage that was taken out on this home.
Original Mortgage
$106,875
Outstanding Balance
$67,414
Interest Rate
6.06%
Mortgage Type
New Conventional
Estimated Equity
$165,816
Purchase Details
Closed on
Mar 31, 2006
Sold by
Payne Charles M
Bought by
Paulk David A and Sara Paulk J
Home Financials for this Owner
Home Financials are based on the most recent Mortgage that was taken out on this home.
Original Mortgage
$94,500
Interest Rate
6.2%
Mortgage Type
New Conventional
Purchase Details
Closed on
Oct 18, 2000
Sold by
Payne Charles M
Bought by
Payne Charles and Payne Equel
Purchase Details
Closed on
Mar 27, 2000
Sold by
Black Brian C
Bought by
Payne Charles M
Purchase Details
Closed on
Sep 3, 1997
Sold by
Brown Franklin and Brown Vic
Bought by
Black Brian C and Black Bren
Create a Home Valuation Report for This Property
The Home Valuation Report is an in-depth analysis detailing your home's value as well as a comparison with similar homes in the area
Home Values in the Area
Average Home Value in this Area
Purchase History
| Date | Buyer | Sale Price | Title Company |
|---|---|---|---|
| Fulks Doris M | $112,500 | -- | |
| Paulk David A | $105,000 | -- | |
| Payne Charles | -- | -- | |
| Payne Charles | $500 | -- | |
| Payne Charles M | $11,800 | -- | |
| Black Brian C | -- | -- | |
| Black Brian C | $10,500 | -- |
Source: Public Records
Mortgage History
| Date | Status | Borrower | Loan Amount |
|---|---|---|---|
| Open | Fulks Doris M | $106,875 | |
| Previous Owner | Paulk David A | $94,500 |
Source: Public Records
Tax History
| Year | Tax Paid | Tax Assessment Tax Assessment Total Assessment is a certain percentage of the fair market value that is determined by local assessors to be the total taxable value of land and additions on the property. | Land | Improvement |
|---|---|---|---|---|
| 2024 | $1,013 | $45,894 | $6,383 | $39,511 |
| 2023 | $972 | $39,400 | $4,354 | $35,046 |
| 2022 | $972 | $39,400 | $4,354 | $35,046 |
| 2021 | $972 | $39,400 | $4,354 | $35,046 |
| 2020 | $972 | $39,400 | $4,354 | $35,046 |
| 2019 | $1,196 | $39,400 | $4,354 | $35,046 |
| 2018 | $1,260 | $39,400 | $4,354 | $35,046 |
| 2017 | $1,260 | $39,400 | $4,354 | $35,046 |
| 2016 | $1,198 | $39,400 | $4,354 | $35,046 |
| 2015 | -- | $39,399 | $4,354 | $35,046 |
| 2014 | -- | $39,400 | $4,354 | $35,046 |
Source: Public Records
Map
Nearby Homes
- 3821 Ga Highway 112 W
- 32 Birdie Cir
- 6415 Coverdale Hwy
- 828 W Madison Ave
- 0 Eagle Ct Unit 135424
- 997 N Railroad Ave
- 883 N Railroad Ave
- 0 N Jefferson St
- 217 W Madison Ave
- 196 N Mattie Ave
- 196 N Mattie Ave Unit 9-10-11
- 943 Whiddon Rd
- 2633 US Hwy 41
- 320 S Mattie Ave
- 0 N Gordon St
- Randall Whiddon Dr
- Randall Whiddon Dr
- Randall Whiddon Dr
- Randall Whiddon Dr Unit LotWP001
- 335 Mclendon St
- 185 Smith Ln
- 186 Smith Ln
- 134 Smith Ln
- 3834 Ga Highway 112 W
- 3834 Georgia 112
- 3820 Ga Highway 112 W
- 118 Smith Ln
- 24 Smith Ln
- 3821 Ga Highway 112 W
- 3494 Ga Highway 112 W
- 3288 Ga Highway 112 W
- 375 Eagle Court Dr
- 195 Country Club Rd
- 4185 Ga Highway 112 W
- 4185 Georgia 112
- 0 Country Club Rd
- 3360 Ga Highway 112 W
- 3360 Georgia 112
- 4349 Ga Highway 112 W
- 163 Glynn Cook Rd
Your Personal Tour Guide
Ask me questions while you tour the home.