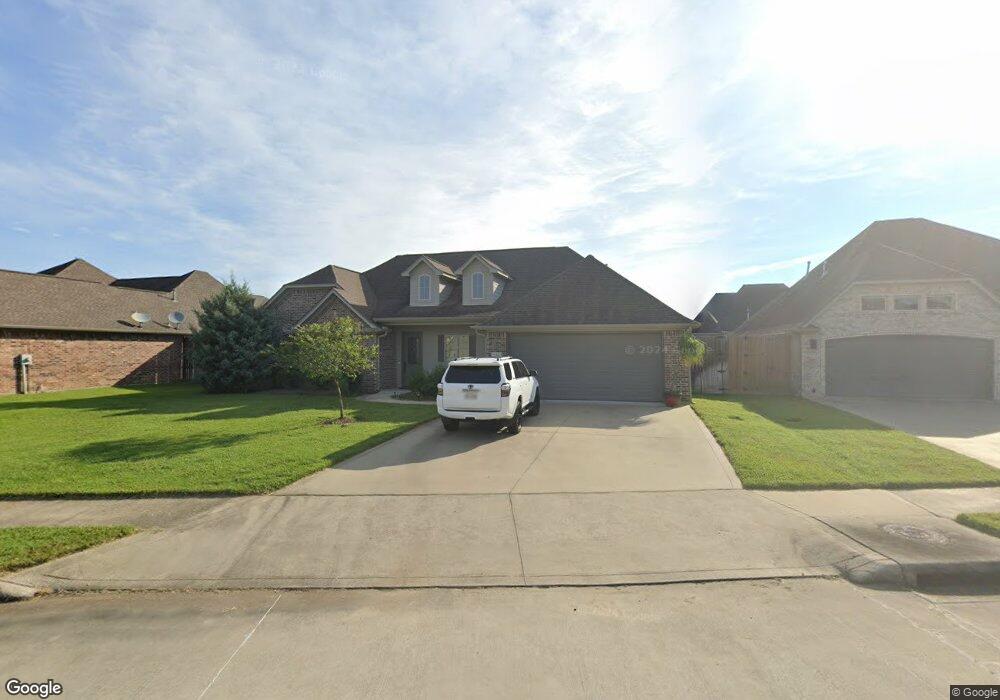
223 Spring Brook Ct Lumberton, TX 77657
Estimated Value: $360,819 - $478,000
3
Beds
2
Baths
2,217
Sq Ft
$183/Sq Ft
Est. Value
About This Home
This home is located at 223 Spring Brook Ct, Lumberton, TX 77657 and is currently estimated at $405,205, approximately $182 per square foot. 223 Spring Brook Ct is a home located in Hardin County with nearby schools including Lumberton Intermediate School, Lumberton Primary School, and Lumberton Middle School.
Ownership History
Date
Name
Owned For
Owner Type
Purchase Details
Closed on
Aug 23, 2024
Sold by
Jones Nyles Kelley
Bought by
Miller Russell Alan and Miller Yelizaveta M
Current Estimated Value
Home Financials for this Owner
Home Financials are based on the most recent Mortgage that was taken out on this home.
Original Mortgage
$346,428
Outstanding Balance
$341,262
Interest Rate
6.89%
Mortgage Type
New Conventional
Estimated Equity
$63,943
Purchase Details
Closed on
Jun 24, 2022
Sold by
Pacheco Diogo F C and Pacheco Jennifer D
Bought by
Jones Nyles Kelley
Purchase Details
Closed on
Nov 20, 2018
Sold by
Labath Bertrand H and Labath Gail T
Bought by
Pacheco Diogo F C and Lewis Jennifer D
Home Financials for this Owner
Home Financials are based on the most recent Mortgage that was taken out on this home.
Original Mortgage
$252,800
Interest Rate
4.8%
Mortgage Type
Purchase Money Mortgage
Purchase Details
Closed on
Sep 5, 2017
Sold by
Tpasa Enterprise Llc
Bought by
Labath Bertrand H and Labath Gail T
Create a Home Valuation Report for This Property
The Home Valuation Report is an in-depth analysis detailing your home's value as well as a comparison with similar homes in the area
Home Values in the Area
Average Home Value in this Area
Purchase History
| Date | Buyer | Sale Price | Title Company |
|---|---|---|---|
| Miller Russell Alan | -- | Capital Title | |
| Jones Nyles Kelley | -- | Shaddock & Associates Pc | |
| Pacheco Diogo F C | -- | Stewart Title | |
| Labath Bertrand H | -- | Attorney |
Source: Public Records
Mortgage History
| Date | Status | Borrower | Loan Amount |
|---|---|---|---|
| Open | Miller Russell Alan | $346,428 | |
| Previous Owner | Pacheco Diogo F C | $252,800 |
Source: Public Records
Tax History
| Year | Tax Paid | Tax Assessment Tax Assessment Total Assessment is a certain percentage of the fair market value that is determined by local assessors to be the total taxable value of land and additions on the property. | Land | Improvement |
|---|---|---|---|---|
| 2025 | $6,205 | $359,015 | $63,419 | $295,596 |
| 2024 | $6,254 | $359,015 | $63,419 | $295,596 |
| 2023 | $6,583 | $365,480 | $63,419 | $302,061 |
| 2022 | $6,170 | $321,728 | $40,803 | $280,925 |
| 2021 | $5,229 | $315,440 | $40,800 | $274,640 |
| 2020 | $4,754 | $252,910 | $40,800 | $212,110 |
| 2019 | $4,914 | $252,910 | $40,800 | $212,110 |
| 2018 | $5,556 | $285,940 | $38,130 | $247,810 |
| 2017 | $226 | $11,440 | $11,440 | $0 |
Source: Public Records
Map
Nearby Homes
- 232 Spring Brook Ct
- 302 Spring Brook Ct
- 230 River Stone Ct
- 1710 Kalas Cir
- 1760 Kala's Cir
- 250 Hidden Grove Ct
- 515 River Birch Dr
- 1360 Jared Dr
- 1360 Jared Dr Unit NEW BUILD PRICE
- 124 River Birch Cir
- 404 Birch View Dr
- 1350 Jared Dr Unit NEW BUILD PRICE
- 1350 Jared Dr
- 303 Winding Brook Dr
- 1325 Natashas Way Unit NEW BUILD PRICE
- 1325 Natashas Way
- 1350 Miss Kyndall
- 1315 Natashas Way Unit NEW BUILD PRICE
- 1315 Natashas Way
- 1310 Natasha's Way
- 213 Spring Brook Ct
- 233 Spring Brook Ct
- 220 Chaple Creek Dr
- 203 Spring Brook Ct
- 230 Chaple Creek Dr
- 243 Spring Brook Ct
- 210 Chaple Creek Dr Unit INCREDIBLE NEW PRICE
- 210 Chaple Creek Dr
- 212 Spring Brook Ct
- 202 Spring Brook Ct
- 222 Spring Brook Ct
- 200 Chaple Creek Dr
- 240 Chaple Creek Dr
- 253 Spring Brook Ct
- 421 River Birch Dr
- 423 River Birch Dr
- 250 Chaple Creek Dr
- 242 Spring Brook Ct
- 225 Chaple Creek Dr
- 263 Spring Brook Ct
Your Personal Tour Guide
Ask me questions while you tour the home.