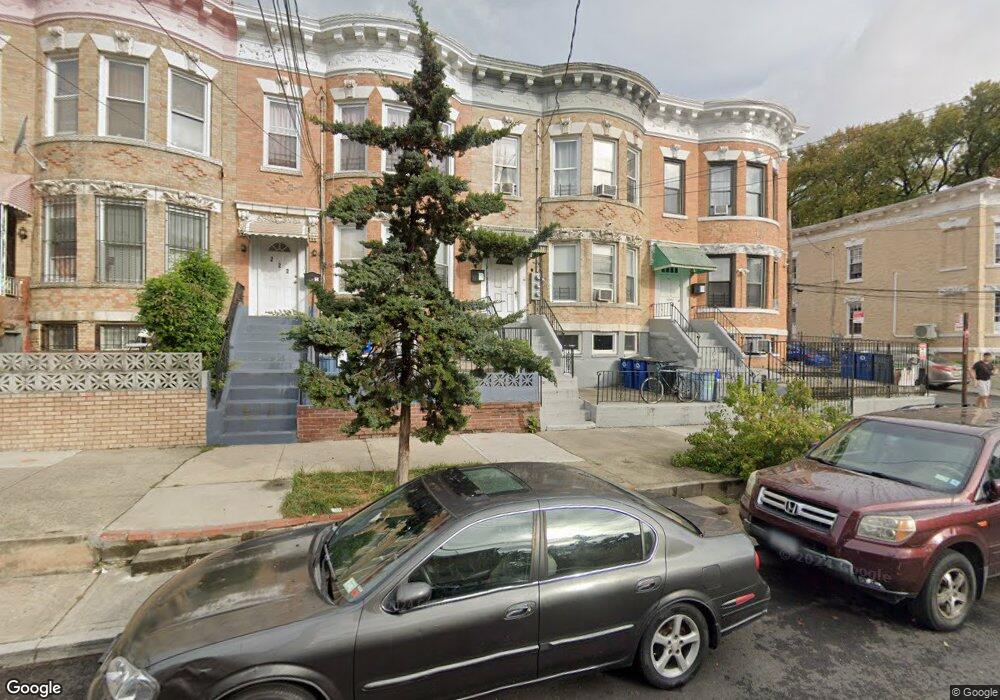
223 Sunnyside Ave Unit 2 Brooklyn, NY 11207
Cypress Hills NeighborhoodEstimated Value: $854,956
3
Beds
1
Bath
900
Sq Ft
$950/Sq Ft
Est. Value
About This Home
This home is located at 223 Sunnyside Ave Unit 2, Brooklyn, NY 11207 and is currently priced at $854,956, approximately $949 per square foot. 223 Sunnyside Ave Unit 2 is a home located in Kings County with nearby schools including P.S. 108 - Sal Abbracciamento, Liberty Avenue Middle School, and Vista Academy.
Ownership History
Date
Name
Owned For
Owner Type
Purchase Details
Closed on
Jan 22, 2025
Sold by
Gomez Jose A and Vazquez Rosa M
Bought by
Mohammed Iahidur
Current Estimated Value
Home Financials for this Owner
Home Financials are based on the most recent Mortgage that was taken out on this home.
Original Mortgage
$688,415
Outstanding Balance
$683,063
Interest Rate
6.85%
Mortgage Type
Purchase Money Mortgage
Purchase Details
Closed on
Nov 15, 2006
Sold by
Infante Juan M
Bought by
Gomez Jose A and Vazquez Rosa M
Home Financials for this Owner
Home Financials are based on the most recent Mortgage that was taken out on this home.
Original Mortgage
$113,000
Interest Rate
6.36%
Purchase Details
Closed on
Feb 26, 2003
Sold by
Moscoso Gustavo B and Moscoso Linda M
Bought by
Infante Juan M
Create a Home Valuation Report for This Property
The Home Valuation Report is an in-depth analysis detailing your home's value as well as a comparison with similar homes in the area
Home Values in the Area
Average Home Value in this Area
Purchase History
| Date | Buyer | Sale Price | Title Company |
|---|---|---|---|
| Mohammed Iahidur | $890,000 | -- | |
| Mohammed Iahidur | $890,000 | -- | |
| Gomez Jose A | $565,000 | -- | |
| Gomez Jose A | $565,000 | -- | |
| Infante Juan M | $222,000 | -- | |
| Infante Juan M | $222,000 | -- |
Source: Public Records
Mortgage History
| Date | Status | Borrower | Loan Amount |
|---|---|---|---|
| Open | Mohammed Iahidur | $688,415 | |
| Closed | Mohammed Iahidur | $688,415 | |
| Previous Owner | Gomez Jose A | $113,000 | |
| Previous Owner | Gomez Jose A | $452,000 | |
| Closed | Infante Juan M | $0 |
Source: Public Records
Tax History Compared to Growth
Tax History
| Year | Tax Paid | Tax Assessment Tax Assessment Total Assessment is a certain percentage of the fair market value that is determined by local assessors to be the total taxable value of land and additions on the property. | Land | Improvement |
|---|---|---|---|---|
| 2025 | $5,536 | $65,760 | $5,160 | $60,600 |
| 2024 | $5,536 | $62,520 | $5,160 | $57,360 |
| 2023 | $5,282 | $76,740 | $5,160 | $71,580 |
| 2022 | $5,192 | $66,840 | $5,160 | $61,680 |
| 2021 | $5,432 | $58,440 | $5,160 | $53,280 |
| 2020 | $2,547 | $49,500 | $5,160 | $44,340 |
| 2019 | $4,805 | $39,360 | $5,160 | $34,200 |
| 2018 | $4,418 | $21,672 | $2,717 | $18,955 |
| 2017 | $4,418 | $21,672 | $3,299 | $18,373 |
| 2016 | $4,300 | $21,508 | $3,663 | $17,845 |
| 2015 | $2,793 | $20,291 | $4,739 | $15,552 |
| 2014 | $2,793 | $19,143 | $5,091 | $14,052 |
Source: Public Records
Map
Nearby Homes
- 3 Schenck Ct
- 33 Jerome St
- 432 Jamaica Ave
- 133 Sunnyside Ave
- 171 Arlington Ave
- 224 Highland Blvd Unit 710
- 117 Cleveland St
- 14 van Siclen Ct
- 54 Elton St
- 168 Warwick St
- 57 Bulwer Place
- 87 Schenck Ave
- 126 Jerome St
- 178 Highland Blvd
- 48 van Siclen Ave
- 153 Hendrix St
- 52 van Siclen Ave
- 90 Jackie Robinson Pkwy
- 2880 Fulton St
- 107 Miller Ave
- 225 Sunnyside Ave
- 229 Sunnyside Ave
- 221 Sunnyside Ave
- 34 Sunnyside Ct
- 34 Sunnyside Ct Unit 2
- 34 Sunnyside Ct Unit 1
- 32 Sunnyside Ct
- 235 Sunnyside Ave
- 213 Sunnyside Ave
- 30 Sunnyside Ct
- 237 Sunnyside Ave
- 211 Sunnyside Ave
- 26 Sunnyside Ct
- 209 Sunnyside Ave
- 239 Sunnyside Ave
- 33 Sunnyside Ct
- 31 Sunnyside Ct
- 31 Sunnyside Ct Unit 2
- 24 Sunnyside Ct
- 207 Sunnyside Ave