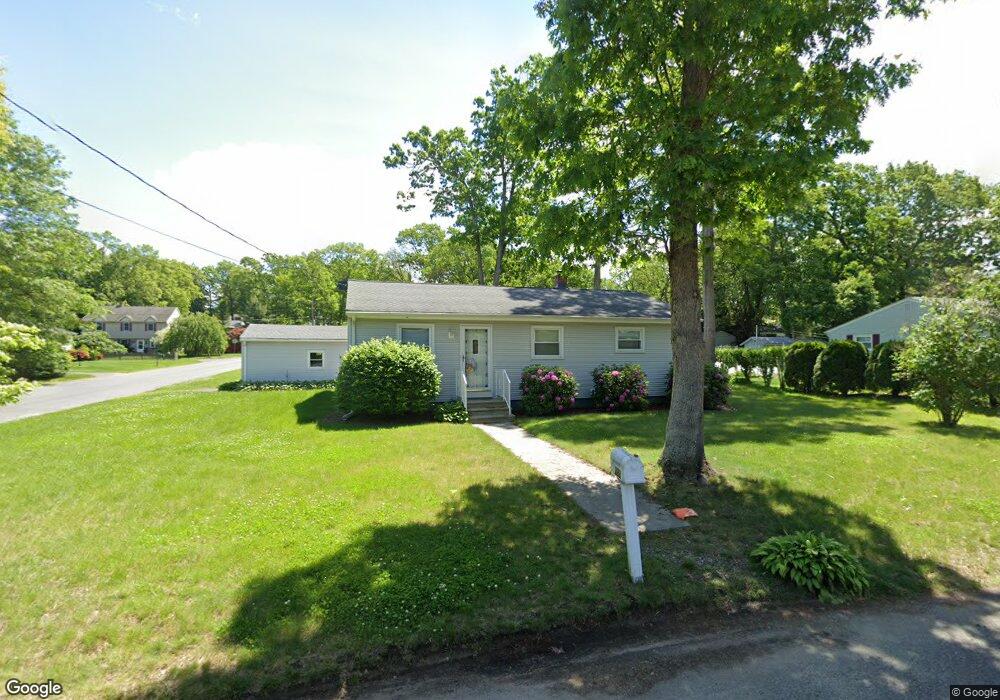
223 Talmadge Dr Springfield, MA 01118
Sixteen Acres NeighborhoodEstimated Value: $284,000 - $293,000
3
Beds
1
Bath
1,053
Sq Ft
$274/Sq Ft
Est. Value
About This Home
This home is located at 223 Talmadge Dr, Springfield, MA 01118 and is currently estimated at $288,263, approximately $273 per square foot. 223 Talmadge Dr is a home located in Hampden County with nearby schools including Arthur T Talmadge Elementary School, M Marcus Kiley Middle, and Springfield High School of Science and Technology.
Ownership History
Date
Name
Owned For
Owner Type
Purchase Details
Closed on
Jul 3, 2018
Sold by
Cyr Gerald and Cyr Barbara
Bought by
Cyr Gerald and Cyr Barbara
Current Estimated Value
Purchase Details
Closed on
Jun 26, 2018
Sold by
Cyr Barbara
Bought by
Cyr Barbara and Cyr Gerald
Purchase Details
Closed on
Jul 21, 1999
Sold by
Marshall Beth
Bought by
Cyr Gerald and Cyr Barbara
Create a Home Valuation Report for This Property
The Home Valuation Report is an in-depth analysis detailing your home's value as well as a comparison with similar homes in the area
Home Values in the Area
Average Home Value in this Area
Purchase History
We collect this data history from publicly available records. To have your information removed, we recommend requesting removal directly through your county’s website.
| Date | Buyer | Sale Price | Title Company |
|---|---|---|---|
| Cyr Gerald | -- | -- | |
| Cyr Barbara | -- | -- | |
| Cyr Gerald | $35,000 | -- |
Source: Public Records
Mortgage History
We collect this data history from publicly available records. To have your information removed, we recommend requesting removal directly through your county’s website.
| Date | Status | Borrower | Loan Amount |
|---|---|---|---|
| Previous Owner | Cyr Gerald | $46,800 | |
| Previous Owner | Cyr Gerald | $52,000 | |
| Previous Owner | Cyr Gerald | $23,000 |
Source: Public Records
Tax History
| Year | Tax Paid | Tax Assessment Tax Assessment Total Assessment is a certain percentage of the fair market value that is determined by local assessors to be the total taxable value of land and additions on the property. | Land | Improvement |
|---|---|---|---|---|
| 2025 | $3,694 | $235,600 | $58,200 | $177,400 |
| 2024 | $3,427 | $213,400 | $58,200 | $155,200 |
| 2023 | $3,422 | $200,700 | $55,400 | $145,300 |
| 2022 | $3,092 | $164,300 | $55,400 | $108,900 |
| 2021 | $2,790 | $147,600 | $50,300 | $97,300 |
| 2020 | $2,842 | $145,500 | $50,300 | $95,200 |
| 2019 | $2,676 | $136,000 | $50,300 | $85,700 |
| 2018 | $2,582 | $131,200 | $50,300 | $80,900 |
| 2017 | $2,501 | $127,200 | $50,300 | $76,900 |
| 2016 | $2,454 | $124,800 | $50,300 | $74,500 |
| 2015 | $2,356 | $119,800 | $50,300 | $69,500 |
Source: Public Records
Map
Nearby Homes
- 231 Talmadge Dr
- 150 Louis Rd
- 207 Talmadge Dr
- 74 Park Forest Rd
- 224 Talmadge Dr
- 241 Talmadge Dr
- 232 Talmadge Dr
- 160 Louis Rd
- 210 Talmadge Dr
- 118 Louis Rd
- 242 Talmadge Dr
- 249 Talmadge Dr
- 195 Talmadge Dr
- 35 Park Forest Rd
- 200 Talmadge Dr
- 141 Louis Rd
- 168 Louis Rd
- 149 Louis Rd
- 229 Newhouse St
- 250 Talmadge Dr
Your Personal Tour Guide
Ask me questions while you tour the home.