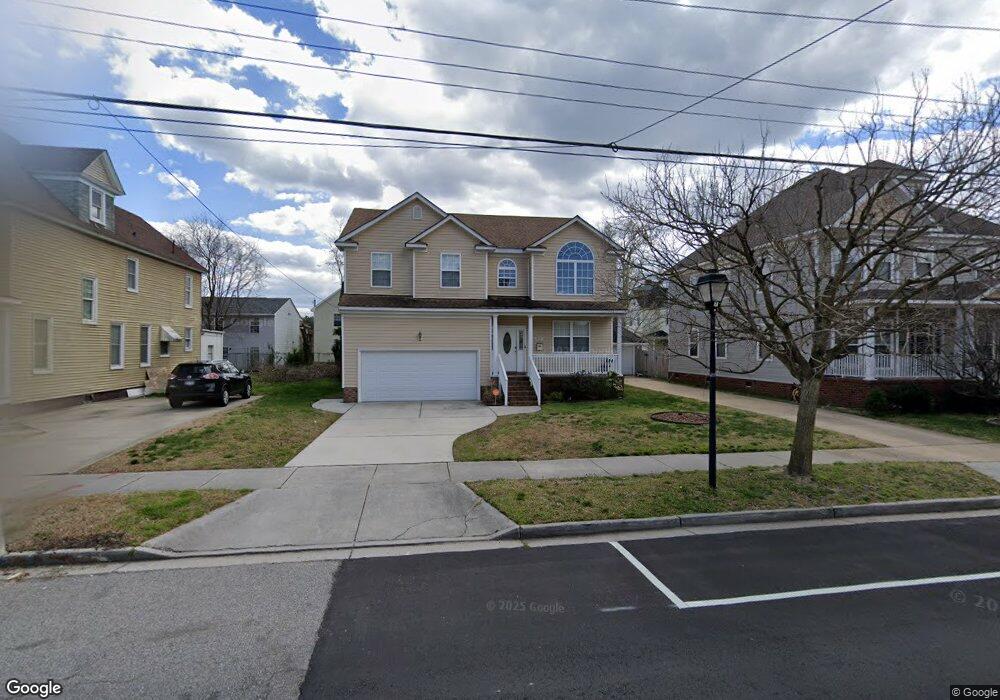
223 W 35th St Norfolk, VA 23504
Park Place NeighborhoodEstimated Value: $412,000 - $454,000
5
Beds
3
Baths
3,100
Sq Ft
$138/Sq Ft
Est. Value
About This Home
This home is located at 223 W 35th St, Norfolk, VA 23504 and is currently estimated at $428,908, approximately $138 per square foot. 223 W 35th St is a home located in Norfolk City with nearby schools including Granby Elementary School, Blair Middle School, and Granby High School.
Ownership History
Date
Name
Owned For
Owner Type
Purchase Details
Closed on
Nov 15, 2006
Sold by
Silverman Charles
Bought by
Campbell Luford C
Current Estimated Value
Home Financials for this Owner
Home Financials are based on the most recent Mortgage that was taken out on this home.
Original Mortgage
$302,155
Outstanding Balance
$155,693
Interest Rate
4%
Mortgage Type
New Conventional
Estimated Equity
$273,215
Purchase Details
Closed on
Jun 1, 2006
Sold by
Pleiss Kevin and Pleiss Carolyn E
Bought by
Silverman Charles
Create a Home Valuation Report for This Property
The Home Valuation Report is an in-depth analysis detailing your home's value as well as a comparison with similar homes in the area
Home Values in the Area
Average Home Value in this Area
Purchase History
| Date | Buyer | Sale Price | Title Company |
|---|---|---|---|
| Campbell Luford C | $311,500 | -- | |
| Silverman Charles | $60,000 | -- |
Source: Public Records
Mortgage History
| Date | Status | Borrower | Loan Amount |
|---|---|---|---|
| Open | Campbell Luford C | $302,155 |
Source: Public Records
Tax History Compared to Growth
Tax History
| Year | Tax Paid | Tax Assessment Tax Assessment Total Assessment is a certain percentage of the fair market value that is determined by local assessors to be the total taxable value of land and additions on the property. | Land | Improvement |
|---|---|---|---|---|
| 2025 | $5,405 | $432,400 | $61,000 | $371,400 |
| 2024 | $5,074 | $412,500 | $61,000 | $351,500 |
| 2023 | $4,729 | $378,300 | $57,000 | $321,300 |
| 2022 | $4,406 | $352,500 | $47,500 | $305,000 |
| 2021 | $3,913 | $313,000 | $47,500 | $265,500 |
| 2020 | $3,705 | $296,400 | $38,500 | $257,900 |
| 2019 | $3,534 | $282,700 | $35,000 | $247,700 |
| 2018 | $3,550 | $284,000 | $33,000 | $251,000 |
| 2017 | $3,236 | $281,400 | $33,000 | $248,400 |
| 2016 | $3,236 | $276,200 | $33,000 | $243,200 |
| 2015 | $3,141 | $276,200 | $33,000 | $243,200 |
| 2014 | $3,141 | $276,200 | $33,000 | $243,200 |
Source: Public Records
Map
Nearby Homes
- 209 W 34th St Unit 201
- 223 W 34th St
- 3223 Omohundro Ave
- 312 W 35th St
- 121 W 32nd St
- 200 W 31st St Unit 301
- 3719 Granby St Unit C-3
- 312 W 30th St
- 404 Carolina Ave
- 436 W 34th St
- 121 W 39th St
- 410 Carolina Ave
- 206 W 29th St
- 325 W 30th St
- 322 W 29th St
- 431 W 31st St Unit A2
- 3716 Colonial Ave
- 3939 Omohundro Ave
- 202 Lucile Ave
- 420 Maryland Ave