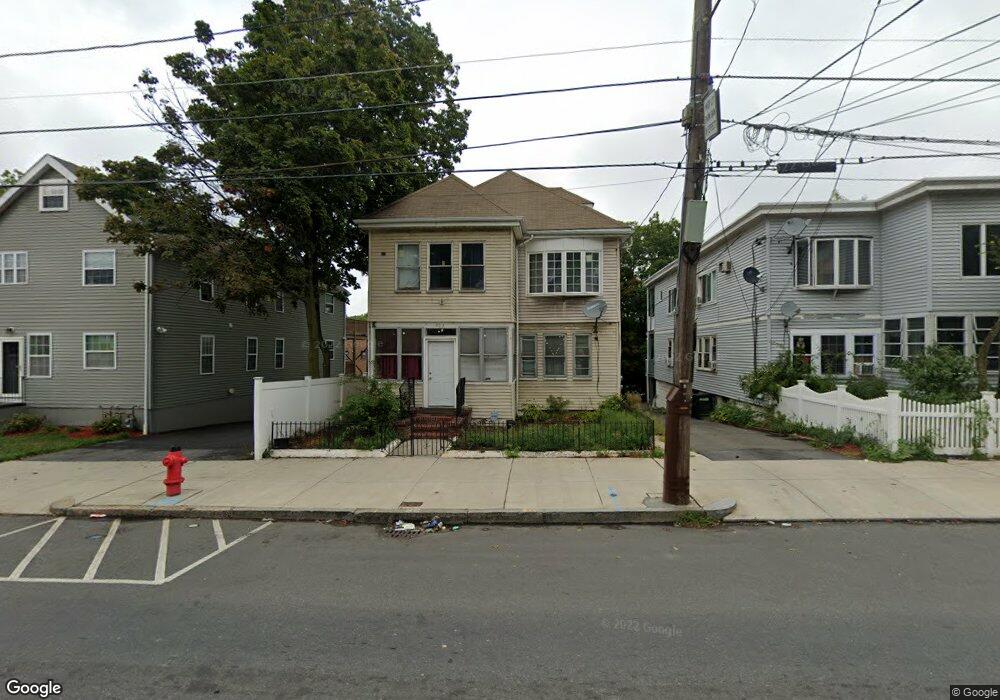
223 Webster Ave Unit 2 Chelsea, MA 02150
Soldiers Home NeighborhoodEstimated Value: $649,000 - $847,640
3
Beds
1
Bath
1,325
Sq Ft
$601/Sq Ft
Est. Value
About This Home
This home is located at 223 Webster Ave Unit 2, Chelsea, MA 02150 and is currently estimated at $795,910, approximately $600 per square foot. 223 Webster Ave Unit 2 is a home located in Suffolk County with nearby schools including Chelsea High School and Eagle Heights Academy.
Ownership History
Date
Name
Owned For
Owner Type
Purchase Details
Closed on
Dec 11, 2023
Sold by
223 Webster Ave Chelsea L
Bought by
Flores-Vasquez Luis A
Current Estimated Value
Home Financials for this Owner
Home Financials are based on the most recent Mortgage that was taken out on this home.
Original Mortgage
$541,818
Outstanding Balance
$533,313
Interest Rate
7.79%
Mortgage Type
FHA
Estimated Equity
$262,597
Purchase Details
Closed on
Oct 1, 2019
Sold by
Mcsheffrey Shawn and Gershaw David
Bought by
223 Webster Ave Llc
Purchase Details
Closed on
Jun 28, 2018
Sold by
Finnigan Mary F
Bought by
Mcsheffrey Shawn and Gershaw David
Purchase Details
Closed on
Jun 11, 2018
Sold by
Plona Karen
Bought by
Finnigan Mary F
Purchase Details
Closed on
Sep 11, 2015
Sold by
M F Finnigan Irt and Finnigan
Bought by
Plona Karen and Finnigan Mary L
Purchase Details
Closed on
Aug 16, 2011
Sold by
Finnigan Mary F
Bought by
Mf Finnigan Irt and Finnigan
Purchase Details
Closed on
Jun 2, 1978
Bought by
Finnigan Mary F
Create a Home Valuation Report for This Property
The Home Valuation Report is an in-depth analysis detailing your home's value as well as a comparison with similar homes in the area
Home Values in the Area
Average Home Value in this Area
Purchase History
| Date | Buyer | Sale Price | Title Company |
|---|---|---|---|
| Flores-Vasquez Luis A | $710,000 | None Available | |
| Flores-Vasquez Luis A | $710,000 | None Available | |
| 223 Webster Ave Llc | -- | -- | |
| 223 Webster Ave Llc | -- | -- | |
| Mcsheffrey Shawn | $550,000 | -- | |
| Mcsheffrey Shawn | $550,000 | -- | |
| Finnigan Mary F | -- | -- | |
| Finnigan Mary F | -- | -- | |
| Plona Karen | -- | -- | |
| Plona Karen | -- | -- | |
| Mf Finnigan Irt | -- | -- | |
| Mf Finnigan Irt | -- | -- | |
| Finnigan Mary F | -- | -- |
Source: Public Records
Mortgage History
| Date | Status | Borrower | Loan Amount |
|---|---|---|---|
| Open | Flores-Vasquez Luis A | $541,818 | |
| Closed | Flores-Vasquez Luis A | $541,818 | |
| Previous Owner | Finnigan Mary F | $1,081 | |
| Previous Owner | Finnigan Mary F | $9,965 |
Source: Public Records
Tax History Compared to Growth
Tax History
| Year | Tax Paid | Tax Assessment Tax Assessment Total Assessment is a certain percentage of the fair market value that is determined by local assessors to be the total taxable value of land and additions on the property. | Land | Improvement |
|---|---|---|---|---|
| 2025 | $8,825 | $766,700 | $233,100 | $533,600 |
| 2024 | $8,499 | $714,200 | $233,100 | $481,100 |
| 2023 | $8,251 | $666,500 | $211,900 | $454,600 |
| 2022 | $8,370 | $631,700 | $201,800 | $429,900 |
| 2021 | $8,107 | $595,200 | $192,200 | $403,000 |
| 2020 | $7,616 | $568,800 | $183,100 | $385,700 |
| 2019 | $5,706 | $400,400 | $183,100 | $217,300 |
| 2018 | $4,970 | $352,500 | $166,400 | $186,100 |
| 2017 | $4,767 | $332,400 | $166,400 | $166,000 |
| 2016 | $4,502 | $315,900 | $166,400 | $149,500 |
| 2015 | $4,157 | $288,700 | $144,700 | $144,000 |
| 2014 | $3,594 | $241,500 | $125,800 | $115,700 |
Source: Public Records
Map
Nearby Homes
- 70 Warren Ave Unit 4-1
- 120 Sagamore Ave
- 7 Ingleside Ave
- 44 Lafayette Place Ave Unit 404
- 505 Washington Ave Unit 42
- 52 Sagamore Ave
- 4 Warren Ave
- 21 Crest Ave
- 286 Fenno St Unit 5
- 275 Washington Ave Unit 3
- 55 Eleanor St Unit 17
- 7 Carmel St
- 2 Laurel St
- 932 Broadway Unit 312
- 164 Ridge Rd
- 330 Washington Ave
- 948 Broadway Unit 13
- 948 Broadway Unit 19
- 379 Fenno St
- 837 Broadway
- 223 Webster Ave
- 221 Webster Ave
- 235 Webster Ave
- 235 Webster Ave Unit 1
- 235 Webster Ave Unit 2
- 219 Webster Ave
- 237 Webster Ave
- 217 Webster Ave
- 241 Webster Ave
- 215 Webster Ave
- 243 Webster Ave
- 00 Webster Unit 1
- 00 Webster Unit 2
- 228 Webster Ave
- 224 Webster Ave
- 230 Webster Ave
- 105 Jefferson Ave
- 220 Webster Ave
- 220 Webster Ave Unit 2
- 222 Webster Ave