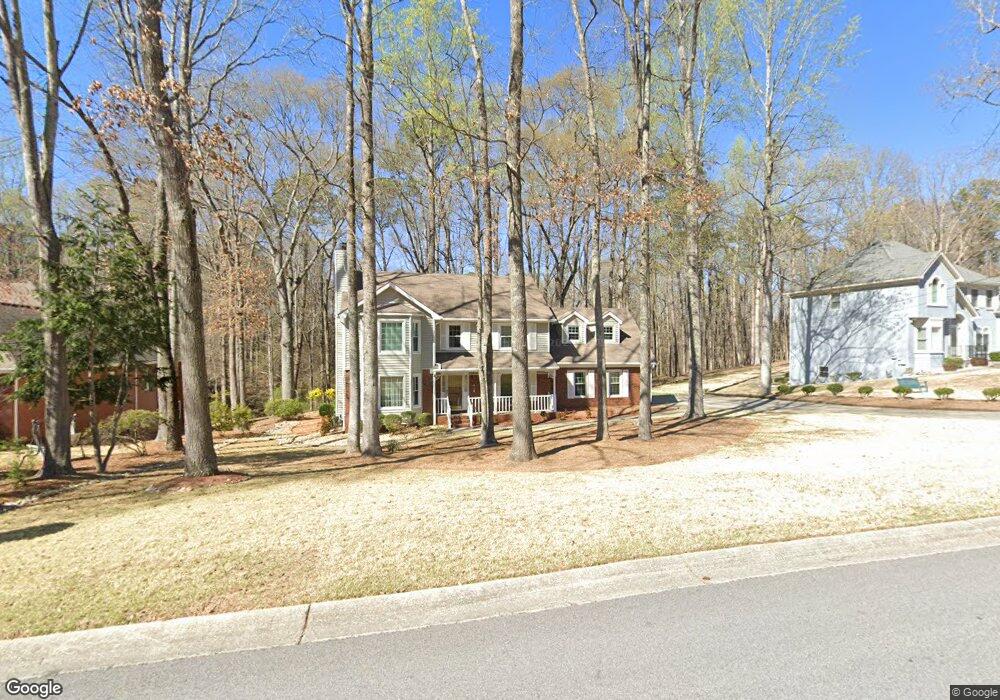
2230 Charleston Place Unit 3 Lithia Springs, GA 30122
Lithia Springs NeighborhoodEstimated Value: $330,000 - $425,000
3
Beds
3
Baths
2,436
Sq Ft
$150/Sq Ft
Est. Value
About This Home
This home is located at 2230 Charleston Place Unit 3, Lithia Springs, GA 30122 and is currently estimated at $366,611, approximately $150 per square foot. 2230 Charleston Place Unit 3 is a home located in Douglas County with nearby schools including Annette Winn Elementary School, Turner Middle School, and Lithia Springs Comprehensive High School.
Ownership History
Date
Name
Owned For
Owner Type
Purchase Details
Closed on
Sep 29, 2006
Sold by
Turner Larry W
Bought by
Jones Bernard
Current Estimated Value
Home Financials for this Owner
Home Financials are based on the most recent Mortgage that was taken out on this home.
Original Mortgage
$146,000
Outstanding Balance
$13,589
Interest Rate
6.46%
Mortgage Type
New Conventional
Estimated Equity
$353,022
Purchase Details
Closed on
Feb 26, 1998
Sold by
Richardson Thomas D and Richardson Dorothy J
Bought by
Turner Larry W and Turner Lisa P
Purchase Details
Closed on
Apr 28, 1994
Sold by
Olsen Richard
Bought by
Richardson Thomas Dorothy
Home Financials for this Owner
Home Financials are based on the most recent Mortgage that was taken out on this home.
Original Mortgage
$104,000
Interest Rate
7.81%
Create a Home Valuation Report for This Property
The Home Valuation Report is an in-depth analysis detailing your home's value as well as a comparison with similar homes in the area
Home Values in the Area
Average Home Value in this Area
Purchase History
| Date | Buyer | Sale Price | Title Company |
|---|---|---|---|
| Jones Bernard | $182,500 | -- | |
| Turner Larry W | $159,900 | -- | |
| Richardson Thomas Dorothy | $130,000 | -- |
Source: Public Records
Mortgage History
| Date | Status | Borrower | Loan Amount |
|---|---|---|---|
| Open | Jones Bernard | $146,000 | |
| Previous Owner | Richardson Thomas Dorothy | $104,000 | |
| Closed | Turner Larry W | -- |
Source: Public Records
Tax History Compared to Growth
Tax History
| Year | Tax Paid | Tax Assessment Tax Assessment Total Assessment is a certain percentage of the fair market value that is determined by local assessors to be the total taxable value of land and additions on the property. | Land | Improvement |
|---|---|---|---|---|
| 2024 | $950 | $123,640 | $26,000 | $97,640 |
| 2023 | $950 | $103,800 | $12,200 | $91,600 |
| 2022 | $987 | $91,200 | $12,200 | $79,000 |
| 2021 | $2,510 | $78,480 | $12,200 | $66,280 |
| 2020 | $2,544 | $78,480 | $12,200 | $66,280 |
| 2019 | $2,576 | $87,200 | $14,000 | $73,200 |
| 2018 | $2,543 | $85,040 | $14,000 | $71,040 |
| 2017 | $2,357 | $75,840 | $14,000 | $61,840 |
| 2016 | $1,810 | $57,680 | $10,960 | $46,720 |
| 2015 | $1,939 | $60,480 | $11,800 | $48,680 |
| 2014 | $1,810 | $55,560 | $11,440 | $44,120 |
| 2013 | -- | $58,880 | $12,200 | $46,680 |
Source: Public Records
Map
Nearby Homes
- Heron Cottage Plan at Paces Estates
- Brookpark Plan at Paces Estates
- Inwood Plan at Paces Estates
- Lakewood Plan at Paces Estates
- 475 Paces Dr
- 480 Paces Dr
- 0 Lakeside Dr Unit 7667066
- 485 Paces Dr
- 515 Paces Dr
- 2180 Highridge Point Dr
- 545 Paces Dr
- 2081 Orchid Ln
- 542 Hasty Dr
- 325 Paces Dr
- 2102 Orchid Ln
- 3347 Skyview Dr
- 6557 Hill St
- 2230 Highridge Point Dr
- 6560 Bowden St
- 2220 Charleston Place
- 2240 Charleston Place
- 0 Charleston Place Unit 8826165
- 0 Charleston Place Unit 8581219
- 0 Charleston Place Unit 3179933
- 0 Charleston Place Unit 8140893
- 0 Charleston Place Unit 7025455
- 0 Charleston Place Unit 7415402
- 0 Charleston Place Unit 7304457
- 0 Charleston Place
- 6780 Heritage Pkwy
- 3 Charleston Place
- 571 Heritage Pkwy
- 2210 Charleston Place
- 567 Heather Dr
- 2250 Charleston Place Unit 3
- 6796 Heritage Pkwy Unit 17
- 6796 Heritage Pkwy
- 577 Heather Dr
- 6795 Heritage Pkwy