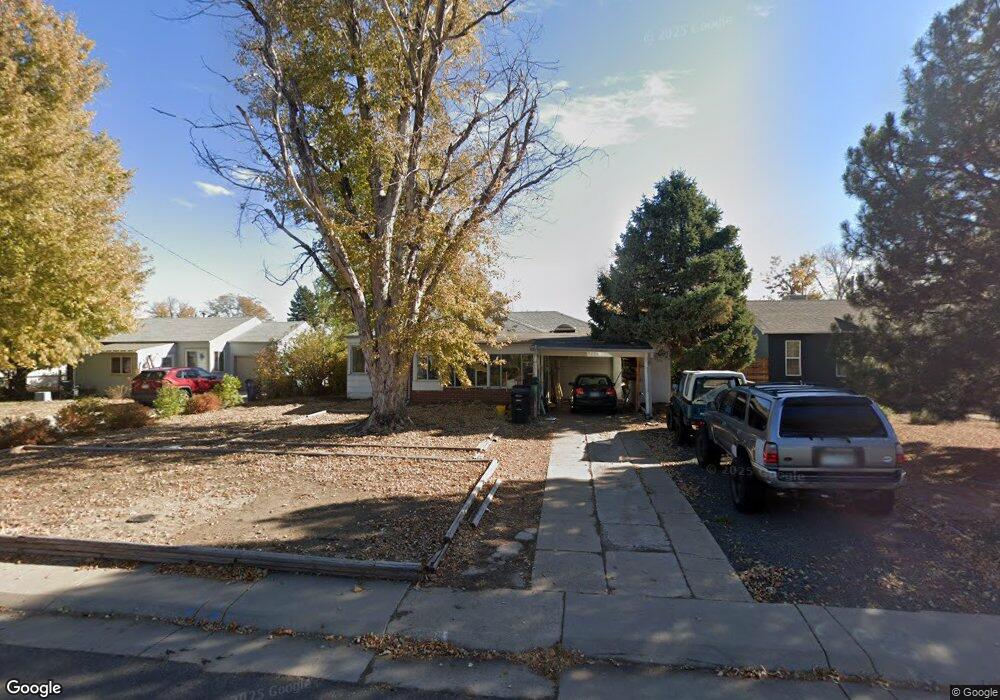
2230 S Irving St Denver, CO 80219
Harvey Park NeighborhoodEstimated Value: $402,000 - $505,000
3
Beds
1
Bath
1,263
Sq Ft
$352/Sq Ft
Est. Value
About This Home
This home is located at 2230 S Irving St, Denver, CO 80219 and is currently estimated at $444,263, approximately $351 per square foot. 2230 S Irving St is a home located in Denver County with nearby schools including Johnson Elementary School, Kepner Beacon Middle School, and West High School.
Ownership History
Date
Name
Owned For
Owner Type
Purchase Details
Closed on
Aug 15, 2025
Sold by
Shepard Douglas C and Shepard Douglas
Bought by
Kocol Deborah
Current Estimated Value
Purchase Details
Closed on
Sep 12, 2005
Sold by
Wachovia Bank Na
Bought by
Shepard Doug
Home Financials for this Owner
Home Financials are based on the most recent Mortgage that was taken out on this home.
Original Mortgage
$105,600
Interest Rate
5.73%
Mortgage Type
Fannie Mae Freddie Mac
Purchase Details
Closed on
Mar 22, 2005
Sold by
Schwenk Paul L
Bought by
Wachovia Bank Na and Long Beach Mortgage Loan Trust 2002-2
Purchase Details
Closed on
May 25, 1999
Sold by
Callagan William A
Bought by
Schwenk Paul L
Home Financials for this Owner
Home Financials are based on the most recent Mortgage that was taken out on this home.
Original Mortgage
$103,550
Interest Rate
6.91%
Create a Home Valuation Report for This Property
The Home Valuation Report is an in-depth analysis detailing your home's value as well as a comparison with similar homes in the area
Home Values in the Area
Average Home Value in this Area
Purchase History
| Date | Buyer | Sale Price | Title Company |
|---|---|---|---|
| Kocol Deborah | -- | None Listed On Document | |
| Shepard Doug | $132,000 | Chicago Title Co | |
| Wachovia Bank Na | -- | -- | |
| Schwenk Paul L | $109,000 | -- |
Source: Public Records
Mortgage History
| Date | Status | Borrower | Loan Amount |
|---|---|---|---|
| Previous Owner | Shepard Doug | $105,600 | |
| Previous Owner | Schwenk Paul L | $103,550 |
Source: Public Records
Tax History Compared to Growth
Tax History
| Year | Tax Paid | Tax Assessment Tax Assessment Total Assessment is a certain percentage of the fair market value that is determined by local assessors to be the total taxable value of land and additions on the property. | Land | Improvement |
|---|---|---|---|---|
| 2024 | $1,491 | $25,520 | $720 | $24,800 |
| 2023 | $1,977 | $25,520 | $720 | $24,800 |
| 2022 | $1,808 | $22,740 | $4,570 | $18,170 |
| 2021 | $1,745 | $23,390 | $4,700 | $18,690 |
| 2020 | $1,537 | $20,710 | $4,280 | $16,430 |
| 2019 | $1,494 | $20,710 | $4,280 | $16,430 |
| 2018 | $1,356 | $17,530 | $3,660 | $13,870 |
| 2017 | $1,352 | $17,530 | $3,660 | $13,870 |
| 2016 | $1,207 | $14,800 | $4,044 | $10,756 |
| 2015 | $1,156 | $14,800 | $4,044 | $10,756 |
| 2014 | $829 | $9,980 | $2,380 | $7,600 |
Source: Public Records
Map
Nearby Homes
- 2105 S Hazel Ct
- 2285 S Knox Ct
- 2380 S Julian St
- 3440 W Evans Ave
- 2505 S Hooker St
- 2081 S King St
- 3180 W Jewell Ave
- 1910 S Knox Ct
- 2370 S Meade St
- 1910 S King St
- 2699 W Iliff Ave
- 2236 S Osceola St
- 2605 S Knox Ct
- 1801 S Grove St
- 1845 S Federal Blvd
- 2455 S Newton St
- 2661 S Hooker St
- 1888 S Michigan Way
- 1863 S Lowell Blvd
- 2655 S Irving St
- 2220 S Irving St
- 2240 S Irving St
- 2210 S Irving St
- 2215 S Hooker Way
- 2225 S Hooker Way
- 2205 S Hooker Way
- 2250 S Irving St
- 2201 S Hooker Way
- 2235 S Hooker Way
- 2200 S Irving St
- 2260 S Irving St
- 2225 S Irving St
- 2215 S Irving St
- 2235 S Irving St
- 2155 S Hooker Way
- 2245 S Hooker Way
- 2245 S Irving St
- 2140 S Irving St
- 2270 S Irving St
- 2255 S Irving St