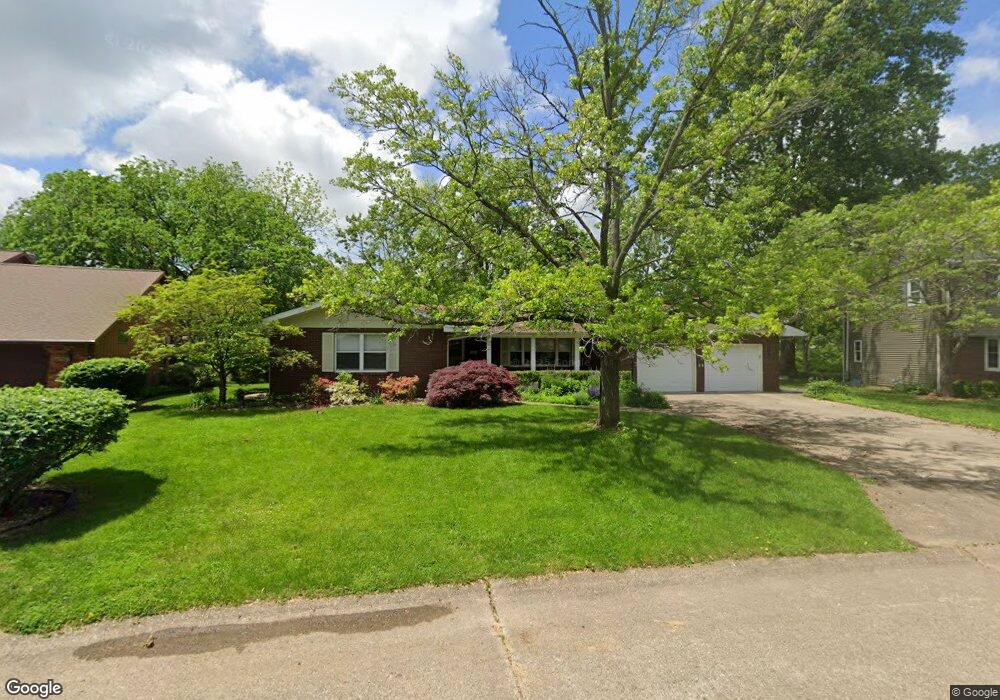
2230 Seneca Dr Charleston, IL 61920
Estimated Value: $290,000 - $397,000
4
Beds
4
Baths
1,896
Sq Ft
$175/Sq Ft
Est. Value
About This Home
This home is located at 2230 Seneca Dr, Charleston, IL 61920 and is currently estimated at $331,102, approximately $174 per square foot. 2230 Seneca Dr is a home located in Coles County with nearby schools including Charleston High School, Charleston Christian Academy, and Charleston Christian Academy High School.
Ownership History
Date
Name
Owned For
Owner Type
Purchase Details
Closed on
May 31, 2023
Sold by
Blitz Jonathan P and Blitz Erin Alise
Bought by
Pellizzeri Steven and Pellizzeri Tiffany
Current Estimated Value
Home Financials for this Owner
Home Financials are based on the most recent Mortgage that was taken out on this home.
Original Mortgage
$239,000
Outstanding Balance
$232,609
Interest Rate
6.39%
Mortgage Type
New Conventional
Estimated Equity
$98,493
Purchase Details
Closed on
Apr 30, 2015
Sold by
Tulin Linda L
Bought by
Blitz Jonathan P and Blitz Erin Alise
Home Financials for this Owner
Home Financials are based on the most recent Mortgage that was taken out on this home.
Original Mortgage
$163,200
Interest Rate
3.77%
Mortgage Type
New Conventional
Purchase Details
Closed on
Jul 6, 2011
Sold by
Sung Jaeyeon S and Sung Nackil
Bought by
Tulin Linda L
Purchase Details
Closed on
Jan 23, 2007
Sold by
Tulin Laura and Tulin Linda
Bought by
Tulin Linda
Create a Home Valuation Report for This Property
The Home Valuation Report is an in-depth analysis detailing your home's value as well as a comparison with similar homes in the area
Home Values in the Area
Average Home Value in this Area
Purchase History
| Date | Buyer | Sale Price | Title Company |
|---|---|---|---|
| Pellizzeri Steven | $299,000 | None Listed On Document | |
| Blitz Jonathan P | $204,000 | Coles County Title | |
| Tulin Linda L | $183,000 | None Available | |
| Tulin Linda | $120,000 | None Available |
Source: Public Records
Mortgage History
| Date | Status | Borrower | Loan Amount |
|---|---|---|---|
| Open | Pellizzeri Steven | $239,000 | |
| Previous Owner | Blitz Jonathan P | $163,200 |
Source: Public Records
Tax History Compared to Growth
Tax History
| Year | Tax Paid | Tax Assessment Tax Assessment Total Assessment is a certain percentage of the fair market value that is determined by local assessors to be the total taxable value of land and additions on the property. | Land | Improvement |
|---|---|---|---|---|
| 2024 | $5,931 | $82,435 | $11,571 | $70,864 |
| 2023 | $5,798 | $75,283 | $10,567 | $64,716 |
| 2022 | $5,801 | $74,039 | $10,392 | $63,647 |
| 2021 | $5,978 | $71,055 | $9,973 | $61,082 |
| 2020 | $5,793 | $70,454 | $12,293 | $58,161 |
| 2019 | $5,680 | $68,000 | $11,865 | $56,135 |
| 2018 | $5,619 | $68,000 | $11,865 | $56,135 |
| 2017 | $5,545 | $68,000 | $11,865 | $56,135 |
| 2016 | $5,498 | $68,000 | $11,865 | $56,135 |
| 2015 | $6,245 | $68,000 | $11,865 | $56,135 |
| 2014 | $6,245 | $74,215 | $11,865 | $62,350 |
| 2013 | $6,245 | $74,215 | $11,865 | $62,350 |
Source: Public Records
Map
Nearby Homes
- 715 W Coolidge Ave
- 634 Fox Lake Dr
- 27 Heather Dr
- 1071 Woodberry Ln
- 1035 Woodberry Ln
- 0 Whitetail Dr
- 911 W Hayes Ave
- 2408 4th St
- 711 Kenton Dr
- 9 Orchard Dr
- 926 Westgate Dr
- 1528 Division St
- 405 Cedar Dr
- 929 Reynolds Dr
- 942 E St
- W Hayes Ave Lot Unit WP001
- 921 Reynolds Dr
- 0 Timberlake Lot 17 Estates
- 124 Polk Ave
- 926 Division St
- 2224 Seneca Dr
- 2231 Seneca Dr
- 2242 Seneca Dr
- 2237 Seneca Dr
- 2218 Seneca Dr
- 2225 Seneca Dr
- 2236 Cortland Dr
- 2219 Seneca Dr
- 2312 Cortland Dr
- 2230 Cortland Dr
- 2224 Cortland Dr
- 2206 Seneca Dr
- 2218 Cortland Dr
- 2213 Seneca Dr
- 2301 Cortland Dr
- 2307 Cortland Dr
- 2307 Andover Place
- 2237 Andover Place
- 2313 Andover Place
- 2212 Cortland Dr