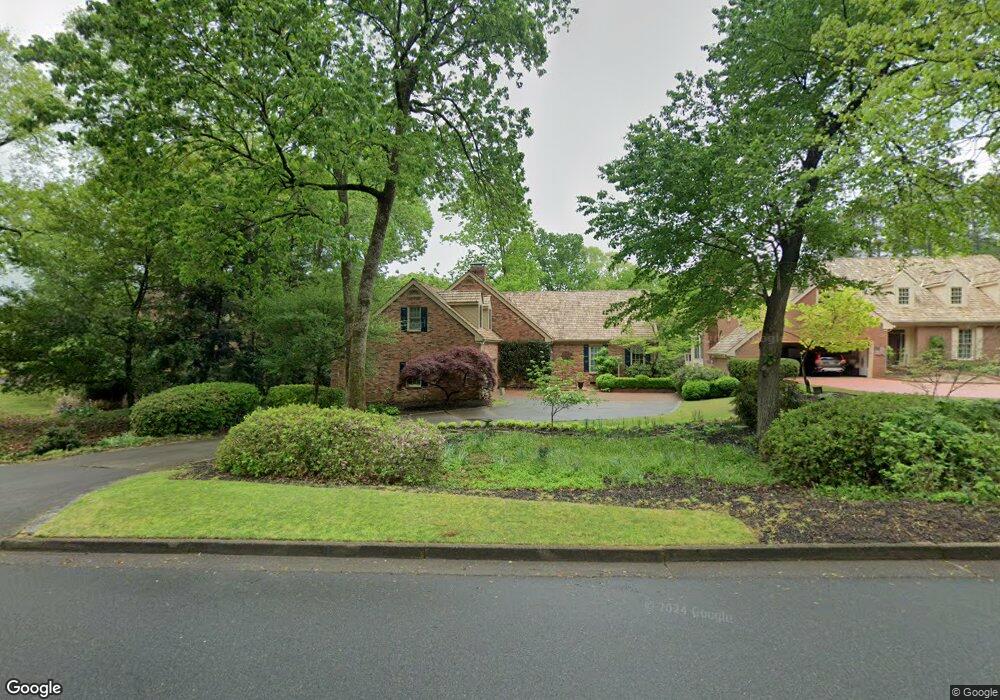
2230 Steeplechase Ln Unit 1 Roswell, GA 30076
Horseshoe Bend NeighborhoodEstimated Value: $832,336 - $976,000
4
Beds
3
Baths
3,577
Sq Ft
$250/Sq Ft
Est. Value
About This Home
This home is located at 2230 Steeplechase Ln Unit 1, Roswell, GA 30076 and is currently estimated at $895,084, approximately $250 per square foot. 2230 Steeplechase Ln Unit 1 is a home located in Fulton County with nearby schools including River Eves Elementary School, Holcomb Bridge Middle School, and Centennial High School.
Ownership History
Date
Name
Owned For
Owner Type
Purchase Details
Closed on
Oct 15, 2013
Sold by
Shelfer Bennett H
Bought by
Taylor Mary Kay and Eastis David
Current Estimated Value
Home Financials for this Owner
Home Financials are based on the most recent Mortgage that was taken out on this home.
Original Mortgage
$237,500
Outstanding Balance
$165,243
Interest Rate
2.7%
Mortgage Type
New Conventional
Estimated Equity
$729,841
Purchase Details
Closed on
Jun 15, 1993
Sold by
Stallings Thomas J Susan R
Bought by
Shelfer Bennett H Baxter B
Home Financials for this Owner
Home Financials are based on the most recent Mortgage that was taken out on this home.
Original Mortgage
$150,000
Interest Rate
7.42%
Create a Home Valuation Report for This Property
The Home Valuation Report is an in-depth analysis detailing your home's value as well as a comparison with similar homes in the area
Home Values in the Area
Average Home Value in this Area
Purchase History
| Date | Buyer | Sale Price | Title Company |
|---|---|---|---|
| Taylor Mary Kay | $487,500 | -- | |
| Shelfer Bennett H Baxter B | $292,500 | -- |
Source: Public Records
Mortgage History
| Date | Status | Borrower | Loan Amount |
|---|---|---|---|
| Open | Taylor Mary Kay | $237,500 | |
| Previous Owner | Shelfer Bennett H Baxter B | $150,000 |
Source: Public Records
Tax History Compared to Growth
Tax History
| Year | Tax Paid | Tax Assessment Tax Assessment Total Assessment is a certain percentage of the fair market value that is determined by local assessors to be the total taxable value of land and additions on the property. | Land | Improvement |
|---|---|---|---|---|
| 2025 | $1,068 | $338,080 | $79,240 | $258,840 |
| 2023 | $7,282 | $258,000 | $45,000 | $213,000 |
| 2022 | $4,729 | $276,440 | $45,000 | $231,440 |
| 2021 | $5,609 | $234,840 | $42,240 | $192,600 |
| 2020 | $5,676 | $200,000 | $31,760 | $168,240 |
| 2019 | $912 | $200,000 | $31,760 | $168,240 |
| 2018 | $4,675 | $200,000 | $31,760 | $168,240 |
| 2017 | $4,837 | $177,720 | $30,120 | $147,600 |
| 2016 | $4,836 | $177,720 | $30,120 | $147,600 |
| 2015 | $6,177 | $177,720 | $30,120 | $147,600 |
| 2014 | $5,448 | $177,720 | $30,120 | $147,600 |
Source: Public Records
Map
Nearby Homes
- 7100 Brookside Dr
- 325 Riverhall Ct Unit 5
- 8665 Steeple Chase Dr
- 8705 River Bluff Ln
- 760 River Gate Dr
- 575 Fourth Fairway Dr
- 106 Cottage Gate Ln
- 105 Cottage Gate Ln
- 112 Cottage Gate Ln
- 108 Cottage Gate Ln
- 110 Larne Ct
- 114 Cottage Gate Ln
- 8320 Sentinae Chase Dr
- 135 Lazy Laurel Chase
- 8290 Jett Ferry Rd
- 2660 Spalding Dr
- 2640 Holcomb Springs Dr
- 555 S Riversong Ln
- 8345 Jett Ferry Rd
- 1789 Riverside Rd
- 2240 Steeplechase Ln Unit A
- 2220 Steeplechase Ln
- 2210 Steeplechase Ln
- 2250 Steeplechase Ln
- 2200 Steeplechase Ln
- 2190 Steeplechase Ln
- 6 Ninth Green Dr
- 4 Ninth Green Dr
- 8 Ninth Green Dr
- 2 Ninth Green Dr
- 2180 Steeplechase Ln
- 205 Tenth Fairway
- 10 Ninth Green Dr
- 215 Tenth Fairway
- 1860 Brandon Hall Dr
- 7 Ninth Green Dr
- 860 Club Chase Ln
- 3 Ninth Green Dr
- 5 Ninth Green Dr
- 7 Ninth Green Dr Unit 6