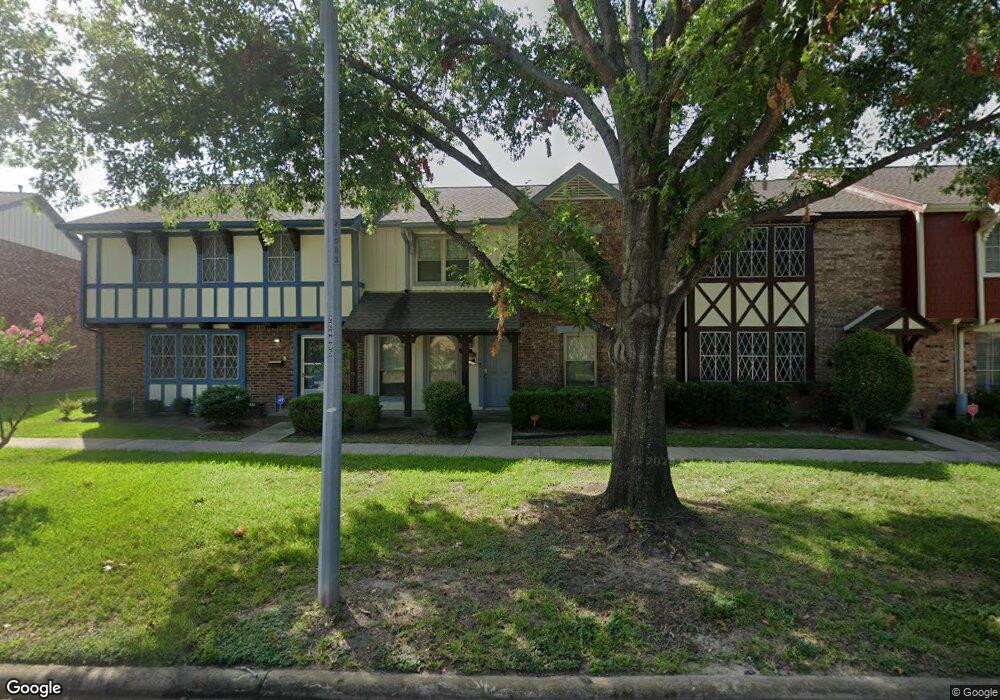
2230 Triway Ln Unit 102 Houston, TX 77043
Spring Shadows NeighborhoodEstimated Value: $170,000 - $198,000
3
Beds
3
Baths
1,452
Sq Ft
$129/Sq Ft
Est. Value
About This Home
This home is located at 2230 Triway Ln Unit 102, Houston, TX 77043 and is currently estimated at $187,019, approximately $128 per square foot. 2230 Triway Ln Unit 102 is a home located in Harris County with nearby schools including Westwood Elementary School, Spring Oaks Middle School, and Spring Woods High School.
Ownership History
Date
Name
Owned For
Owner Type
Purchase Details
Closed on
Jun 15, 2005
Sold by
Mondragon Anthony R and Mondragon Julie
Bought by
Caballero Javier and Harris Lois
Current Estimated Value
Home Financials for this Owner
Home Financials are based on the most recent Mortgage that was taken out on this home.
Original Mortgage
$84,000
Outstanding Balance
$43,909
Interest Rate
5.78%
Mortgage Type
Fannie Mae Freddie Mac
Estimated Equity
$143,110
Purchase Details
Closed on
Dec 13, 2002
Sold by
Vey Julie M
Bought by
Mondragon Anthony R
Home Financials for this Owner
Home Financials are based on the most recent Mortgage that was taken out on this home.
Original Mortgage
$88,000
Interest Rate
6.05%
Purchase Details
Closed on
Sep 21, 2001
Sold by
Campbell Frank Lee and Campbell Louise G
Bought by
Mondragon Anthony R
Home Financials for this Owner
Home Financials are based on the most recent Mortgage that was taken out on this home.
Original Mortgage
$80,000
Interest Rate
10.37%
Create a Home Valuation Report for This Property
The Home Valuation Report is an in-depth analysis detailing your home's value as well as a comparison with similar homes in the area
Home Values in the Area
Average Home Value in this Area
Purchase History
| Date | Buyer | Sale Price | Title Company |
|---|---|---|---|
| Caballero Javier | -- | Dhi Title | |
| Mondragon Anthony R | -- | First Southwestern Title Co | |
| Mondragon Anthony R | -- | Stewart Title |
Source: Public Records
Mortgage History
| Date | Status | Borrower | Loan Amount |
|---|---|---|---|
| Open | Caballero Javier | $84,000 | |
| Previous Owner | Mondragon Anthony R | $88,000 | |
| Previous Owner | Mondragon Anthony R | $80,000 |
Source: Public Records
Tax History Compared to Growth
Tax History
| Year | Tax Paid | Tax Assessment Tax Assessment Total Assessment is a certain percentage of the fair market value that is determined by local assessors to be the total taxable value of land and additions on the property. | Land | Improvement |
|---|---|---|---|---|
| 2025 | -- | $181,852 | $60,000 | $121,852 |
| 2024 | -- | $179,655 | $60,000 | $119,655 |
| 2023 | $3,868 | $178,115 | $60,000 | $118,115 |
| 2022 | $3,839 | $162,427 | $60,000 | $102,427 |
| 2021 | $3,495 | $143,149 | $50,000 | $93,149 |
| 2020 | $3,577 | $143,149 | $50,000 | $93,149 |
| 2019 | $3,392 | $137,357 | $40,000 | $97,357 |
| 2018 | $1,110 | $126,820 | $40,000 | $86,820 |
| 2017 | $2,698 | $126,820 | $40,000 | $86,820 |
| 2016 | $2,453 | $126,820 | $40,000 | $86,820 |
| 2015 | $1,441 | $111,645 | $35,000 | $76,645 |
| 2014 | $1,441 | $77,491 | $20,000 | $57,491 |
Source: Public Records
Map
Nearby Homes
- 10466 Hammerly Blvd Unit 70
- 2233 Triway Ln Unit 267
- 10488 Hammerly Blvd Unit 81
- 2342 Triway Ln Unit 147
- 2219 Triway Ln Unit 240
- 10382 Hammerly Blvd
- 10227 Emnora Ln
- 2252 Shadowdale Dr Unit 362
- 2212 Shadowdale Dr Unit 358
- 2202 Shadowdale Dr Unit 353
- 10415 Westray St
- 2603 Durban Dr
- 2618 Fontana Dr
- 2614 Manila Ln
- 2103 Southwick St
- 10214 Moorberry Ln
- 10525 Moorberry Ln
- 10226 Rothbury St
- 10227 Knoboak Dr
- 2706 Stetson Ln
- 2232 Triway Ln Unit 103
- 2228 Triway Ln Unit 101
- 2234 Triway Ln Unit 104
- 2226 Triway Ln Unit 100
- 2224 Triway Ln Unit 99
- 2224 Triway Ln Unit 1
- 2236 Triway Ln Unit 105
- 2222 Triway Ln
- 2238 Triway Ln Unit 106
- 10460 Hammerly Blvd
- 2220 Triway Ln Unit 97
- 2218 Triway Ln Unit 96
- 2240 Triway Ln Unit 107
- 2216 Triway Ln Unit 95
- 2270 Triway Ln Unit 122
- 2242 Triway Ln Unit 108
- 10486 Hammerly Blvd
- 10458 Hammerly Blvd Unit 66
- 2212 Triway Ln Unit 93
- 2272 Triway Ln Unit 123