
Seller's Agent in 2025
Jorge Downie
Keller Williams Greater 360
(360) 620-2992
4 in this area
136 Total Sales
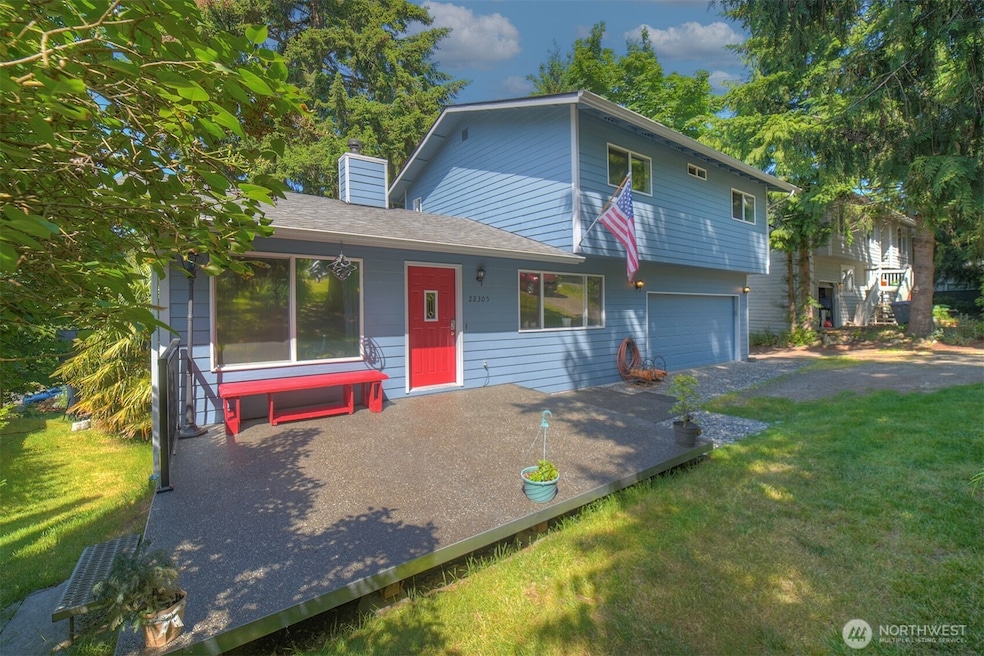
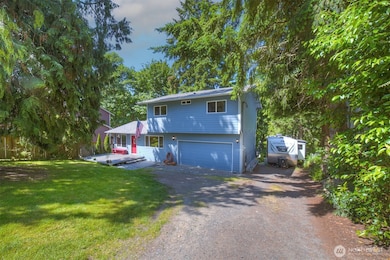
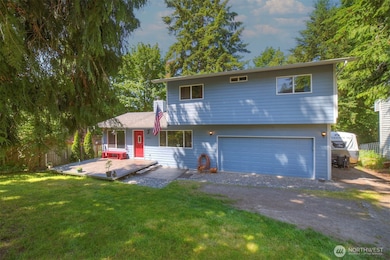
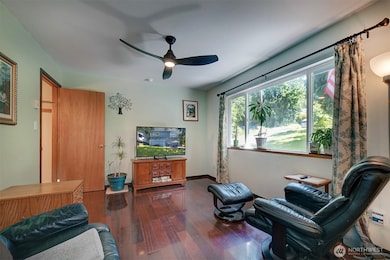
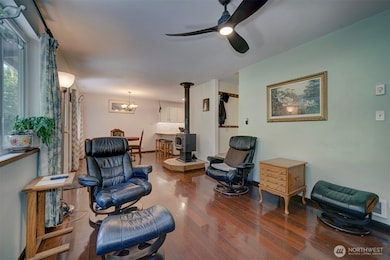
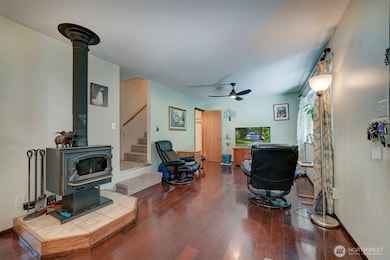
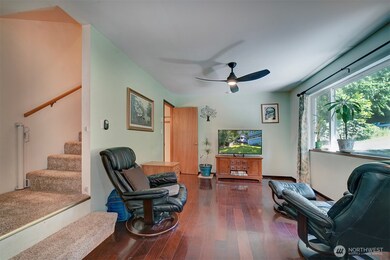
Welcome to this beautiful 3-bed, 2.5-bath gem in Miller Bay Estates! With a newer roof, updated kitchen, refreshed flooring, remodeled primary bedroom and bath, and a welcoming aggregate front entry, this home blends comfort and function. The open living and dining areas flow perfectly for everyday living, while the lower level offers a cozy family room and dedicated craft space. Enjoy outdoor entertaining on the large patio, plenty of multifunction storage, and dedicated RV parking. Community perks include waterfront access, clubhouse, playground, basketball court, and a seasonal pool. Just minutes to Poulsbo, Kingston, Naval Base Kitsap, and ferries!
Last Agent to Sell the Property
Keller Williams Greater 360 License #138013 Listed on: 06/06/2025
Source: Northwest Multiple Listing Service (NWMLS)
MLS#: 2388791
| Date | Type | Sale Price | Title Company |
|---|---|---|---|
| Warranty Deed | $535,000 | Pacific Northwest Title | |
| Interfamily Deed Transfer | -- | None Available | |
| Bargain Sale Deed | $140,000 | Land Title Company | |
| Warranty Deed | $143,717 | Land Title Co |
| Date | Status | Loan Amount | Loan Type |
|---|---|---|---|
| Open | $360,000 | New Conventional | |
| Previous Owner | $150,000 | New Conventional | |
| Previous Owner | $112,000 | Seller Take Back |
| Date | Event | Price | Change | Sq Ft Price |
|---|---|---|---|---|
| 08/08/2025 08/08/25 | Sold | $535,000 | 0.0% | $279 / Sq Ft |
| 06/23/2025 06/23/25 | Pending | -- | -- | -- |
| 06/06/2025 06/06/25 | For Sale | $535,000 | -- | $279 / Sq Ft |
| Year | Tax Paid | Tax Assessment Tax Assessment Total Assessment is a certain percentage of the fair market value that is determined by local assessors to be the total taxable value of land and additions on the property. | Land | Improvement |
|---|---|---|---|---|
| 2026 | $4,166 | $459,500 | $70,560 | $388,940 |
| 2025 | $4,166 | $456,190 | $55,770 | $400,420 |
| 2024 | $4,030 | $456,190 | $55,770 | $400,420 |
| 2023 | $4,087 | $456,190 | $55,770 | $400,420 |
| 2022 | $3,361 | $355,310 | $46,410 | $308,900 |
| 2021 | $3,344 | $323,230 | $42,120 | $281,110 |
| 2020 | $3,150 | $300,500 | $39,000 | $261,500 |
| 2019 | $3,236 | $310,050 | $40,890 | $269,160 |
| 2018 | $2,984 | $241,890 | $37,010 | $204,880 |
| 2017 | $2,881 | $241,890 | $37,010 | $204,880 |
| 2016 | $2,695 | $207,070 | $35,250 | $171,820 |
| 2015 | $2,607 | $201,660 | $35,250 | $166,410 |
| 2014 | -- | $197,600 | $35,250 | $162,350 |
| 2013 | -- | $213,200 | $53,040 | $160,160 |
Seller's Agent in 2025
Jorge Downie
Keller Williams Greater 360
(360) 620-2992
4 in this area
136 Total Sales
Seller Co-Listing Agent in 2025
Kelsey Ramirez
Keller Williams Greater 360
(843) 685-8495
4 in this area
166 Total Sales
Buyer's Agent in 2025
Billy Lam
COMPASS
(253) 363-2111
1 in this area
40 Total Sales
Source: Northwest Multiple Listing Service (NWMLS)
MLS Number: 2388791
APN: 4373-003-023-00-08
Disclaimer: Certain information contained herein is derived from information provided by parties other than Homes.com. All information provided is deemed reliable, but is not guaranteed to be accurate and should be independently verified.
![]() All data is obtained from various sources and may not have been verified by broker or MLS GRID. Supplied Open House Information is subject to change without notice. All information should be independently reviewed and verified for accuracy. Properties may or may not be listed by the office/agent presenting the information. Listing information is provided by the Northwest Multiple Listing Service (NWMLS). Property information is based on available data that may include MLS information, county records, and other sources. Listings marked with the 3 tree icon and provided by NWMLS. All properties are subject to prior sale or withdrawal. IDX information is provided exclusively for consumers’ personal noncommercial use, that it may not be used for any purpose other than to identify prospective properties consumers may be interested in purchasing, that the data is deemed reliable but is not guaranteed by MLS GRID. ©2025 NWMLS.
All data is obtained from various sources and may not have been verified by broker or MLS GRID. Supplied Open House Information is subject to change without notice. All information should be independently reviewed and verified for accuracy. Properties may or may not be listed by the office/agent presenting the information. Listing information is provided by the Northwest Multiple Listing Service (NWMLS). Property information is based on available data that may include MLS information, county records, and other sources. Listings marked with the 3 tree icon and provided by NWMLS. All properties are subject to prior sale or withdrawal. IDX information is provided exclusively for consumers’ personal noncommercial use, that it may not be used for any purpose other than to identify prospective properties consumers may be interested in purchasing, that the data is deemed reliable but is not guaranteed by MLS GRID. ©2025 NWMLS.
Based on information submitted to the MLS GRID