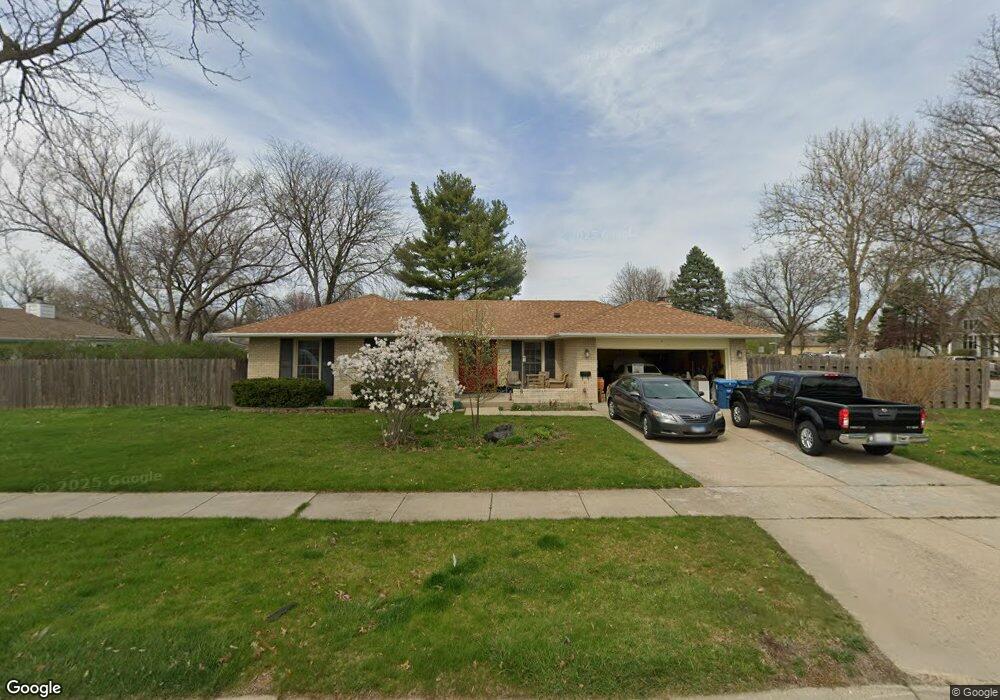
2231 Copley St Aurora, IL 60506
Edgelawn Randall NeighborhoodEstimated Value: $335,000 - $346,000
3
Beds
3
Baths
1,648
Sq Ft
$206/Sq Ft
Est. Value
About This Home
This home is located at 2231 Copley St, Aurora, IL 60506 and is currently estimated at $339,801, approximately $206 per square foot. 2231 Copley St is a home located in Kane County with nearby schools including Hall Elementary School, Jefferson Middle School, and West Aurora High School.
Ownership History
Date
Name
Owned For
Owner Type
Purchase Details
Closed on
Apr 27, 2010
Sold by
Fannie Mae
Bought by
Jett Nicholas
Current Estimated Value
Home Financials for this Owner
Home Financials are based on the most recent Mortgage that was taken out on this home.
Original Mortgage
$179,685
Outstanding Balance
$118,755
Interest Rate
5.16%
Mortgage Type
FHA
Estimated Equity
$221,046
Purchase Details
Closed on
Jan 13, 2010
Sold by
Ramos Hilario and Ramos Generosa
Bought by
Federal National Mortgage Association
Purchase Details
Closed on
Mar 26, 2003
Sold by
Beaber Robert M and Beaber Florence I
Bought by
Ramos Hilaro and Ramos Generosa
Home Financials for this Owner
Home Financials are based on the most recent Mortgage that was taken out on this home.
Original Mortgage
$123,000
Interest Rate
5.71%
Mortgage Type
Purchase Money Mortgage
Create a Home Valuation Report for This Property
The Home Valuation Report is an in-depth analysis detailing your home's value as well as a comparison with similar homes in the area
Home Values in the Area
Average Home Value in this Area
Purchase History
| Date | Buyer | Sale Price | Title Company |
|---|---|---|---|
| Jett Nicholas | $183,000 | Attorneys Title Guaranty Fun | |
| Federal National Mortgage Association | -- | None Available | |
| Ramos Hilaro | $173,000 | First American Title Ins Co |
Source: Public Records
Mortgage History
| Date | Status | Borrower | Loan Amount |
|---|---|---|---|
| Open | Jett Nicholas | $179,685 | |
| Previous Owner | Ramos Hilaro | $123,000 |
Source: Public Records
Tax History
| Year | Tax Paid | Tax Assessment Tax Assessment Total Assessment is a certain percentage of the fair market value that is determined by local assessors to be the total taxable value of land and additions on the property. | Land | Improvement |
|---|---|---|---|---|
| 2024 | $7,118 | $97,895 | $15,912 | $81,983 |
| 2023 | $6,807 | $87,468 | $14,217 | $73,251 |
| 2022 | $6,533 | $79,807 | $12,972 | $66,835 |
| 2021 | $6,240 | $74,301 | $12,077 | $62,224 |
| 2020 | $5,899 | $69,015 | $11,218 | $57,797 |
| 2019 | $5,564 | $62,902 | $10,394 | $52,508 |
| 2018 | $5,083 | $56,919 | $9,614 | $47,305 |
| 2017 | $5,378 | $58,254 | $8,858 | $49,396 |
| 2016 | $4,785 | $51,039 | $7,593 | $43,446 |
| 2015 | -- | $44,471 | $6,529 | $37,942 |
| 2014 | -- | $41,211 | $7,326 | $33,885 |
| 2013 | -- | $43,029 | $5,674 | $37,355 |
Source: Public Records
Map
Nearby Homes
- 2220 Mayflower St
- 2487 Worthington Dr
- 2472 Fox Dr
- 873 Shady Ln
- 1734 Rosedale Ct
- 1071 Almond Dr
- 1730 W Galena Blvd Unit 402E
- 123 N Rosedale Ave
- 2416 Courtyard Cir Unit 2
- 106 Hillwood Place Unit 5A
- 1126 Village Center Pkwy Unit 6
- 115 N Western Ave
- 1930 Sapphire Ln
- 170 Alschuler Dr
- 980 Sapphire Ln
- 968 Sapphire Ln
- 960 Sapphire Ln
- 972 Sapphire Ln
- 988 Sapphire Ln
- 976 Sapphire Ln
- 450 N Constitution Dr Unit 1
- 2240 Copley St Unit 1
- 2086 Constitution Ct
- 2220 Mayflower Dr
- 2251 Copley St
- 480 N Constitution Dr
- 2082 Constitution Ct
- 2230 Mayflower Dr
- 2087 Constitution Ct
- 2078 Constitution Ct
- 2083 Constitution Ct
- 2250 Copley St
- 2074 Constitution Ct
- 2240 Mayflower Dr
- 350 N Constitution Dr
- 2079 Constitution Ct
- 2259 Copley St
- 2070 Constitution Ct
- 2075 Constitution Ct
- 2066 Constitution Ct
Your Personal Tour Guide
Ask me questions while you tour the home.